This document is not up-to-date, please refer to the Japanese document.
Data Visualization
Using InfoMotion to visualize data.
This tutorial will do 'Import assets and visualise Flow data in an InfoMotion'.(Time required 50 minutes)
Table of Contents
- Import a Flow
- Creating a Datasource
- Editing and Deploying the Flow
- Registering a DataSource for InfoMotion
- Import an InfoType
- Creating an InfoMotion
Import a Flow
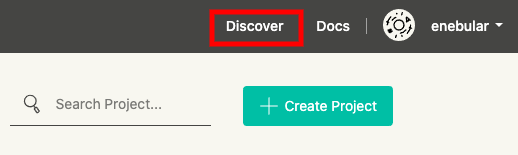
Enebular allows users to publish and import Assets. At the right top part of the window click on Discover.
Select Flow as the asset type and enter “getting-started” in the search bar.
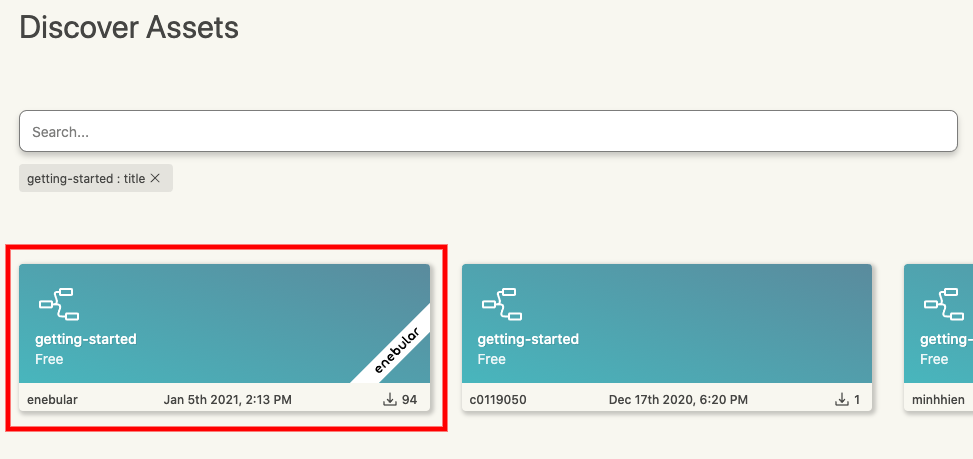
Clicking on the flow from the search result which displays the enebular label will display a details screen. Click the “Import” button to import that flow.
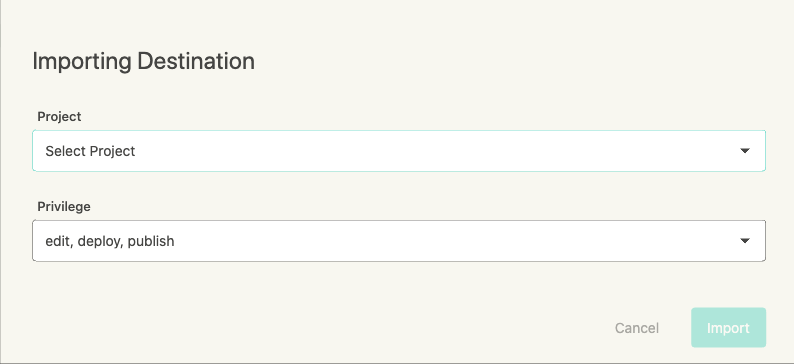
Select the project to import to and the Default asset role. (For now select edit, deploy, publish)
Go back to your project dashboard to see the new asset you just imported.
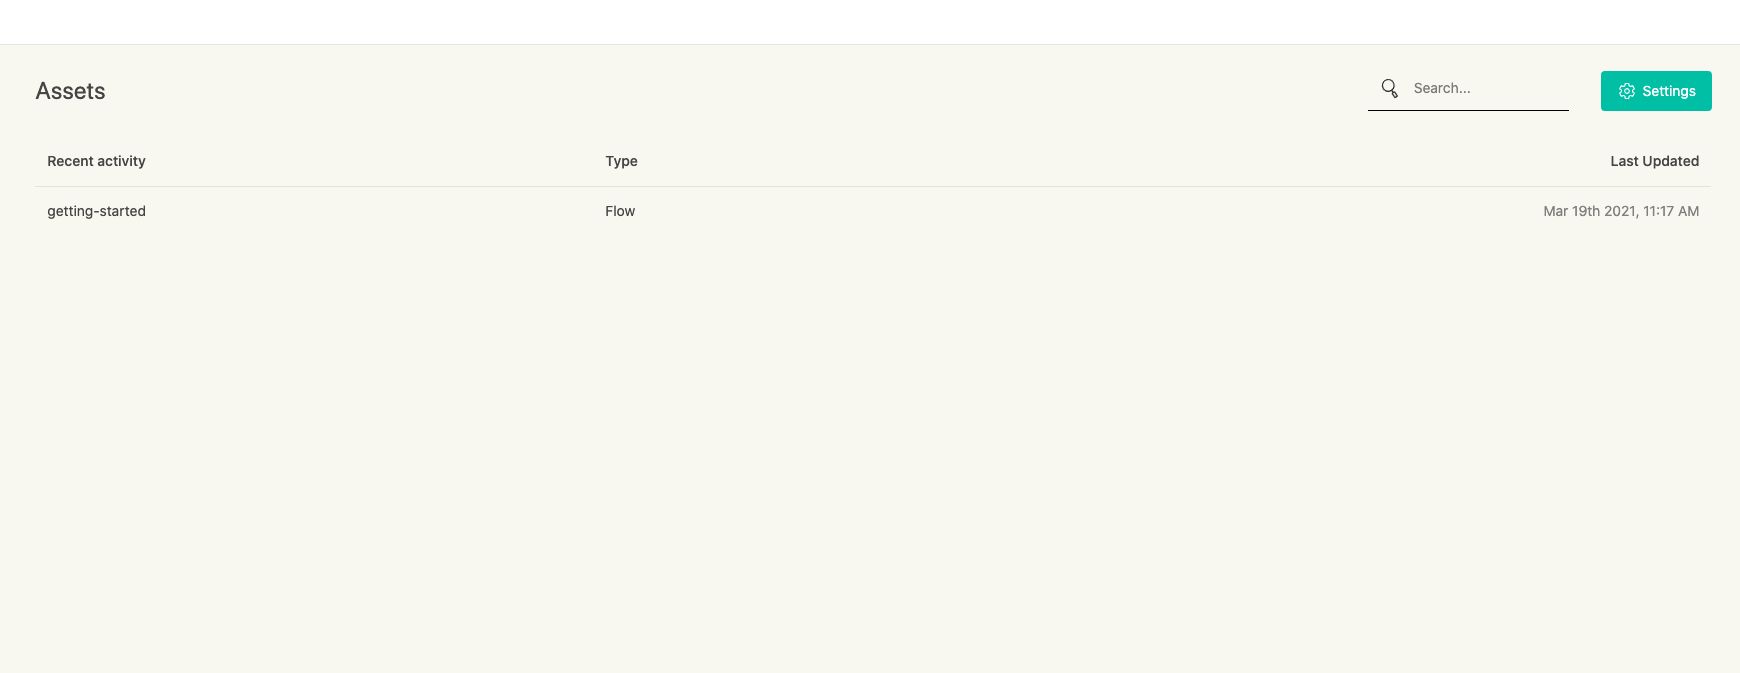
The imported Flow should look like this.
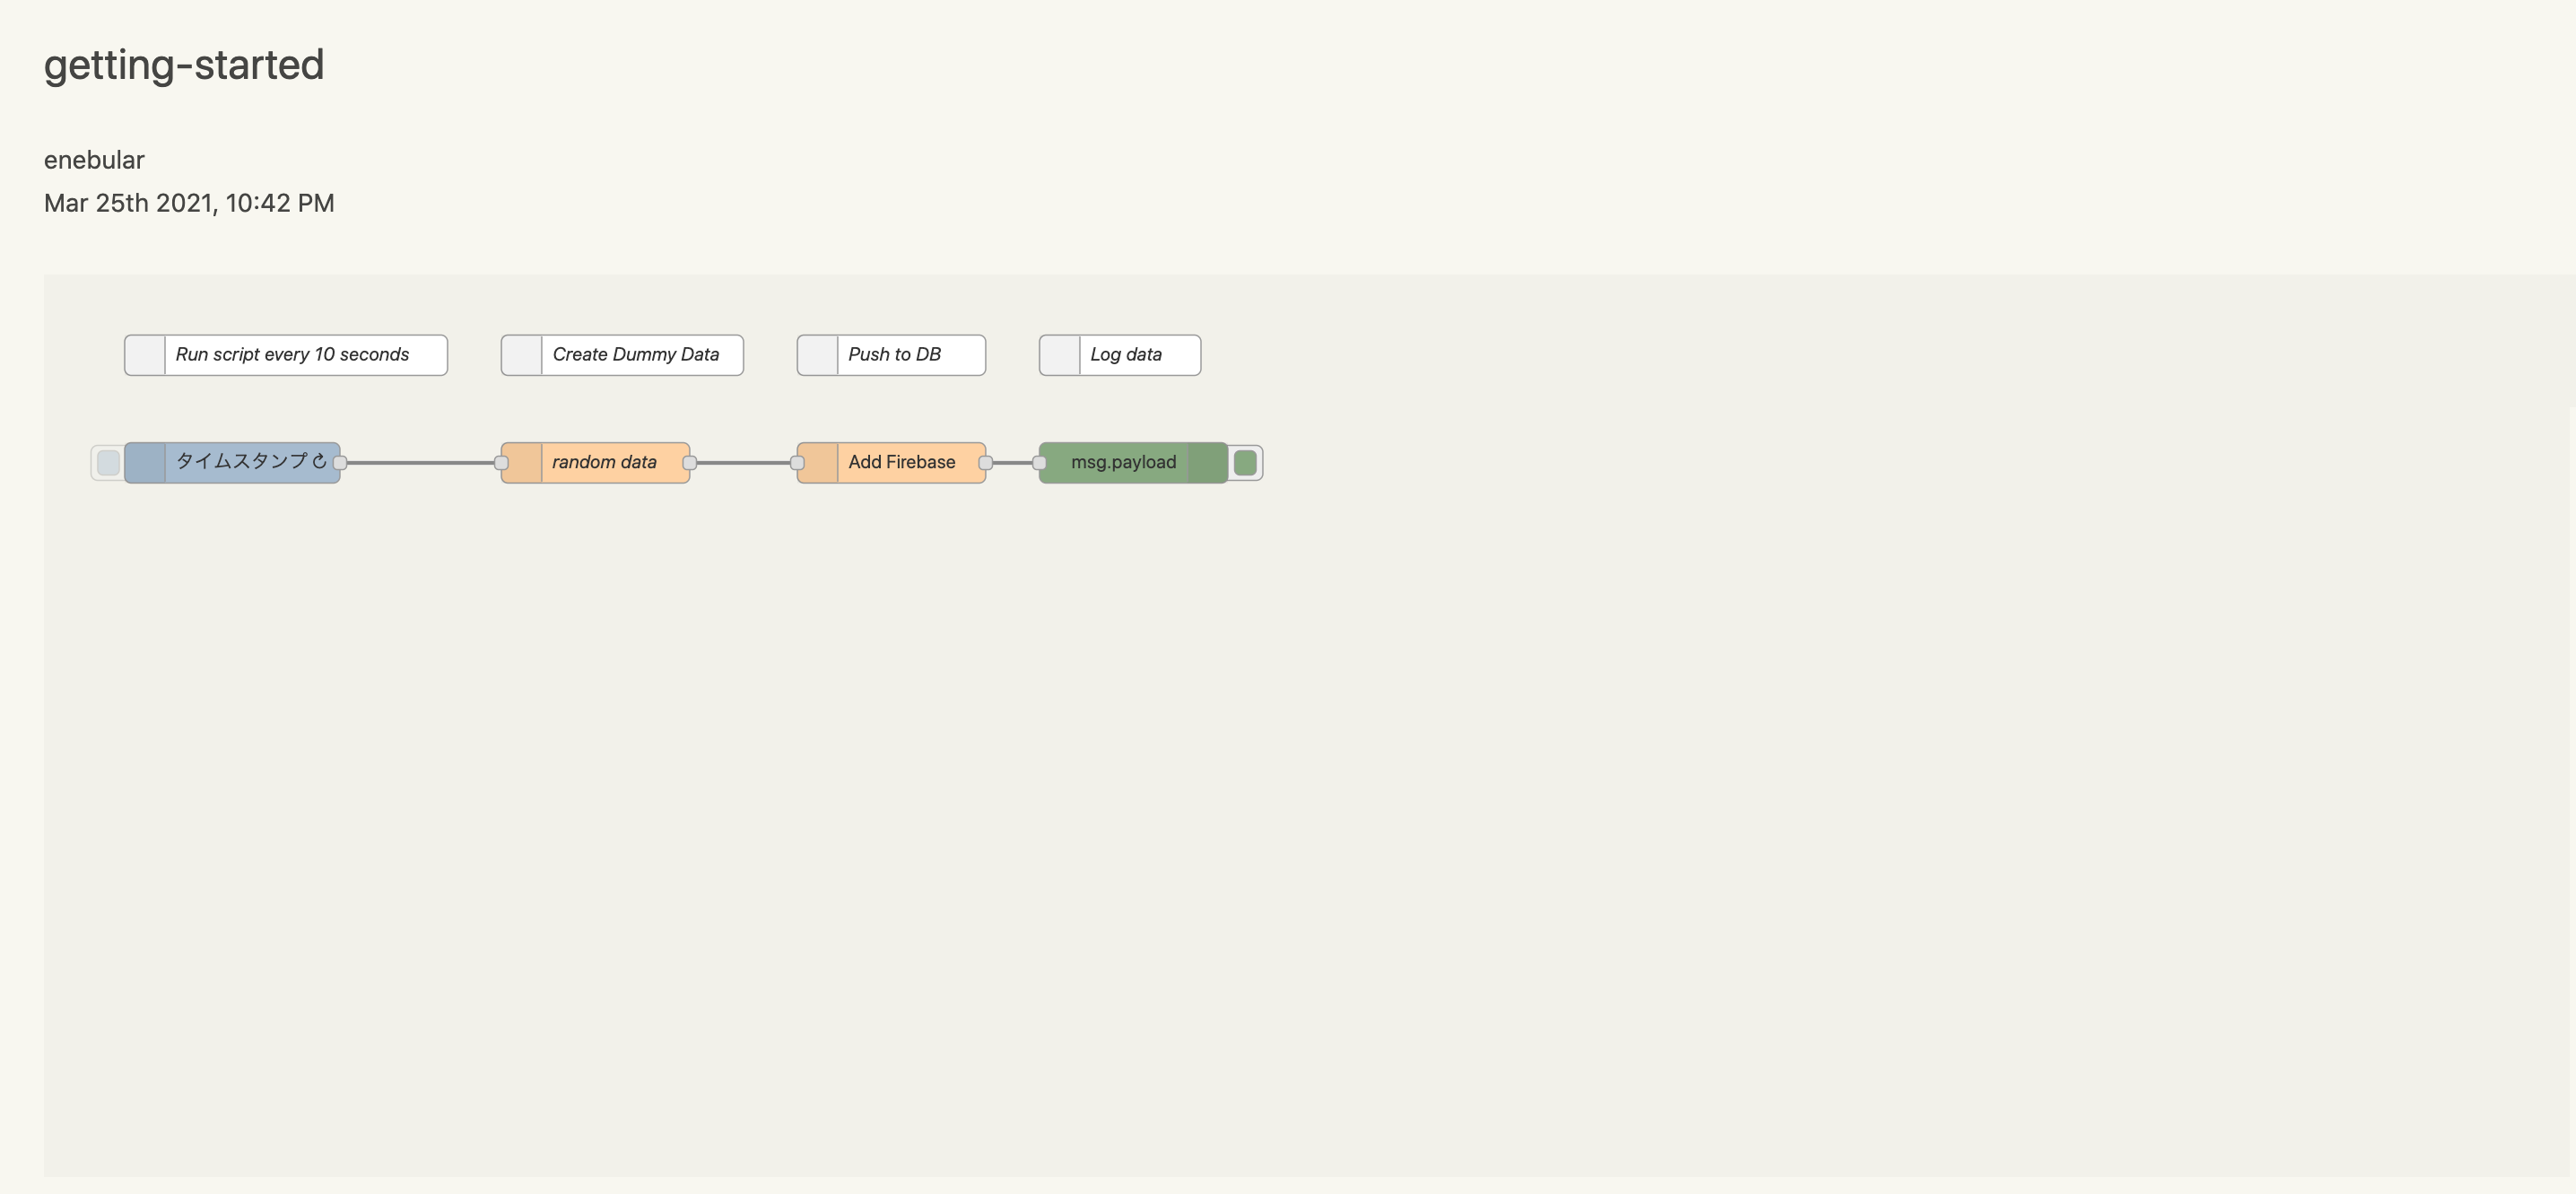
This flow will have blanks for the each of the authentication information data sources, so before deploying, the flow will need to be edited.
Creating a Datasource
Below are the current real time databases used in InfoMotion.
See documentation for simple registration and and set up configurations.
This tutorial uses Firebase.
Before proceed to the next step, you have to register and create dataStore. Please refer to Firebase.
*The following configurations are for testing usage only and not recommended for production.
Editing and Deploying the Flow
Set credentials to Node and deploy flow.
This tutorial only set uo Firebase Node.
Acquire private key
Open the console for the application that was set in the Firebase page.
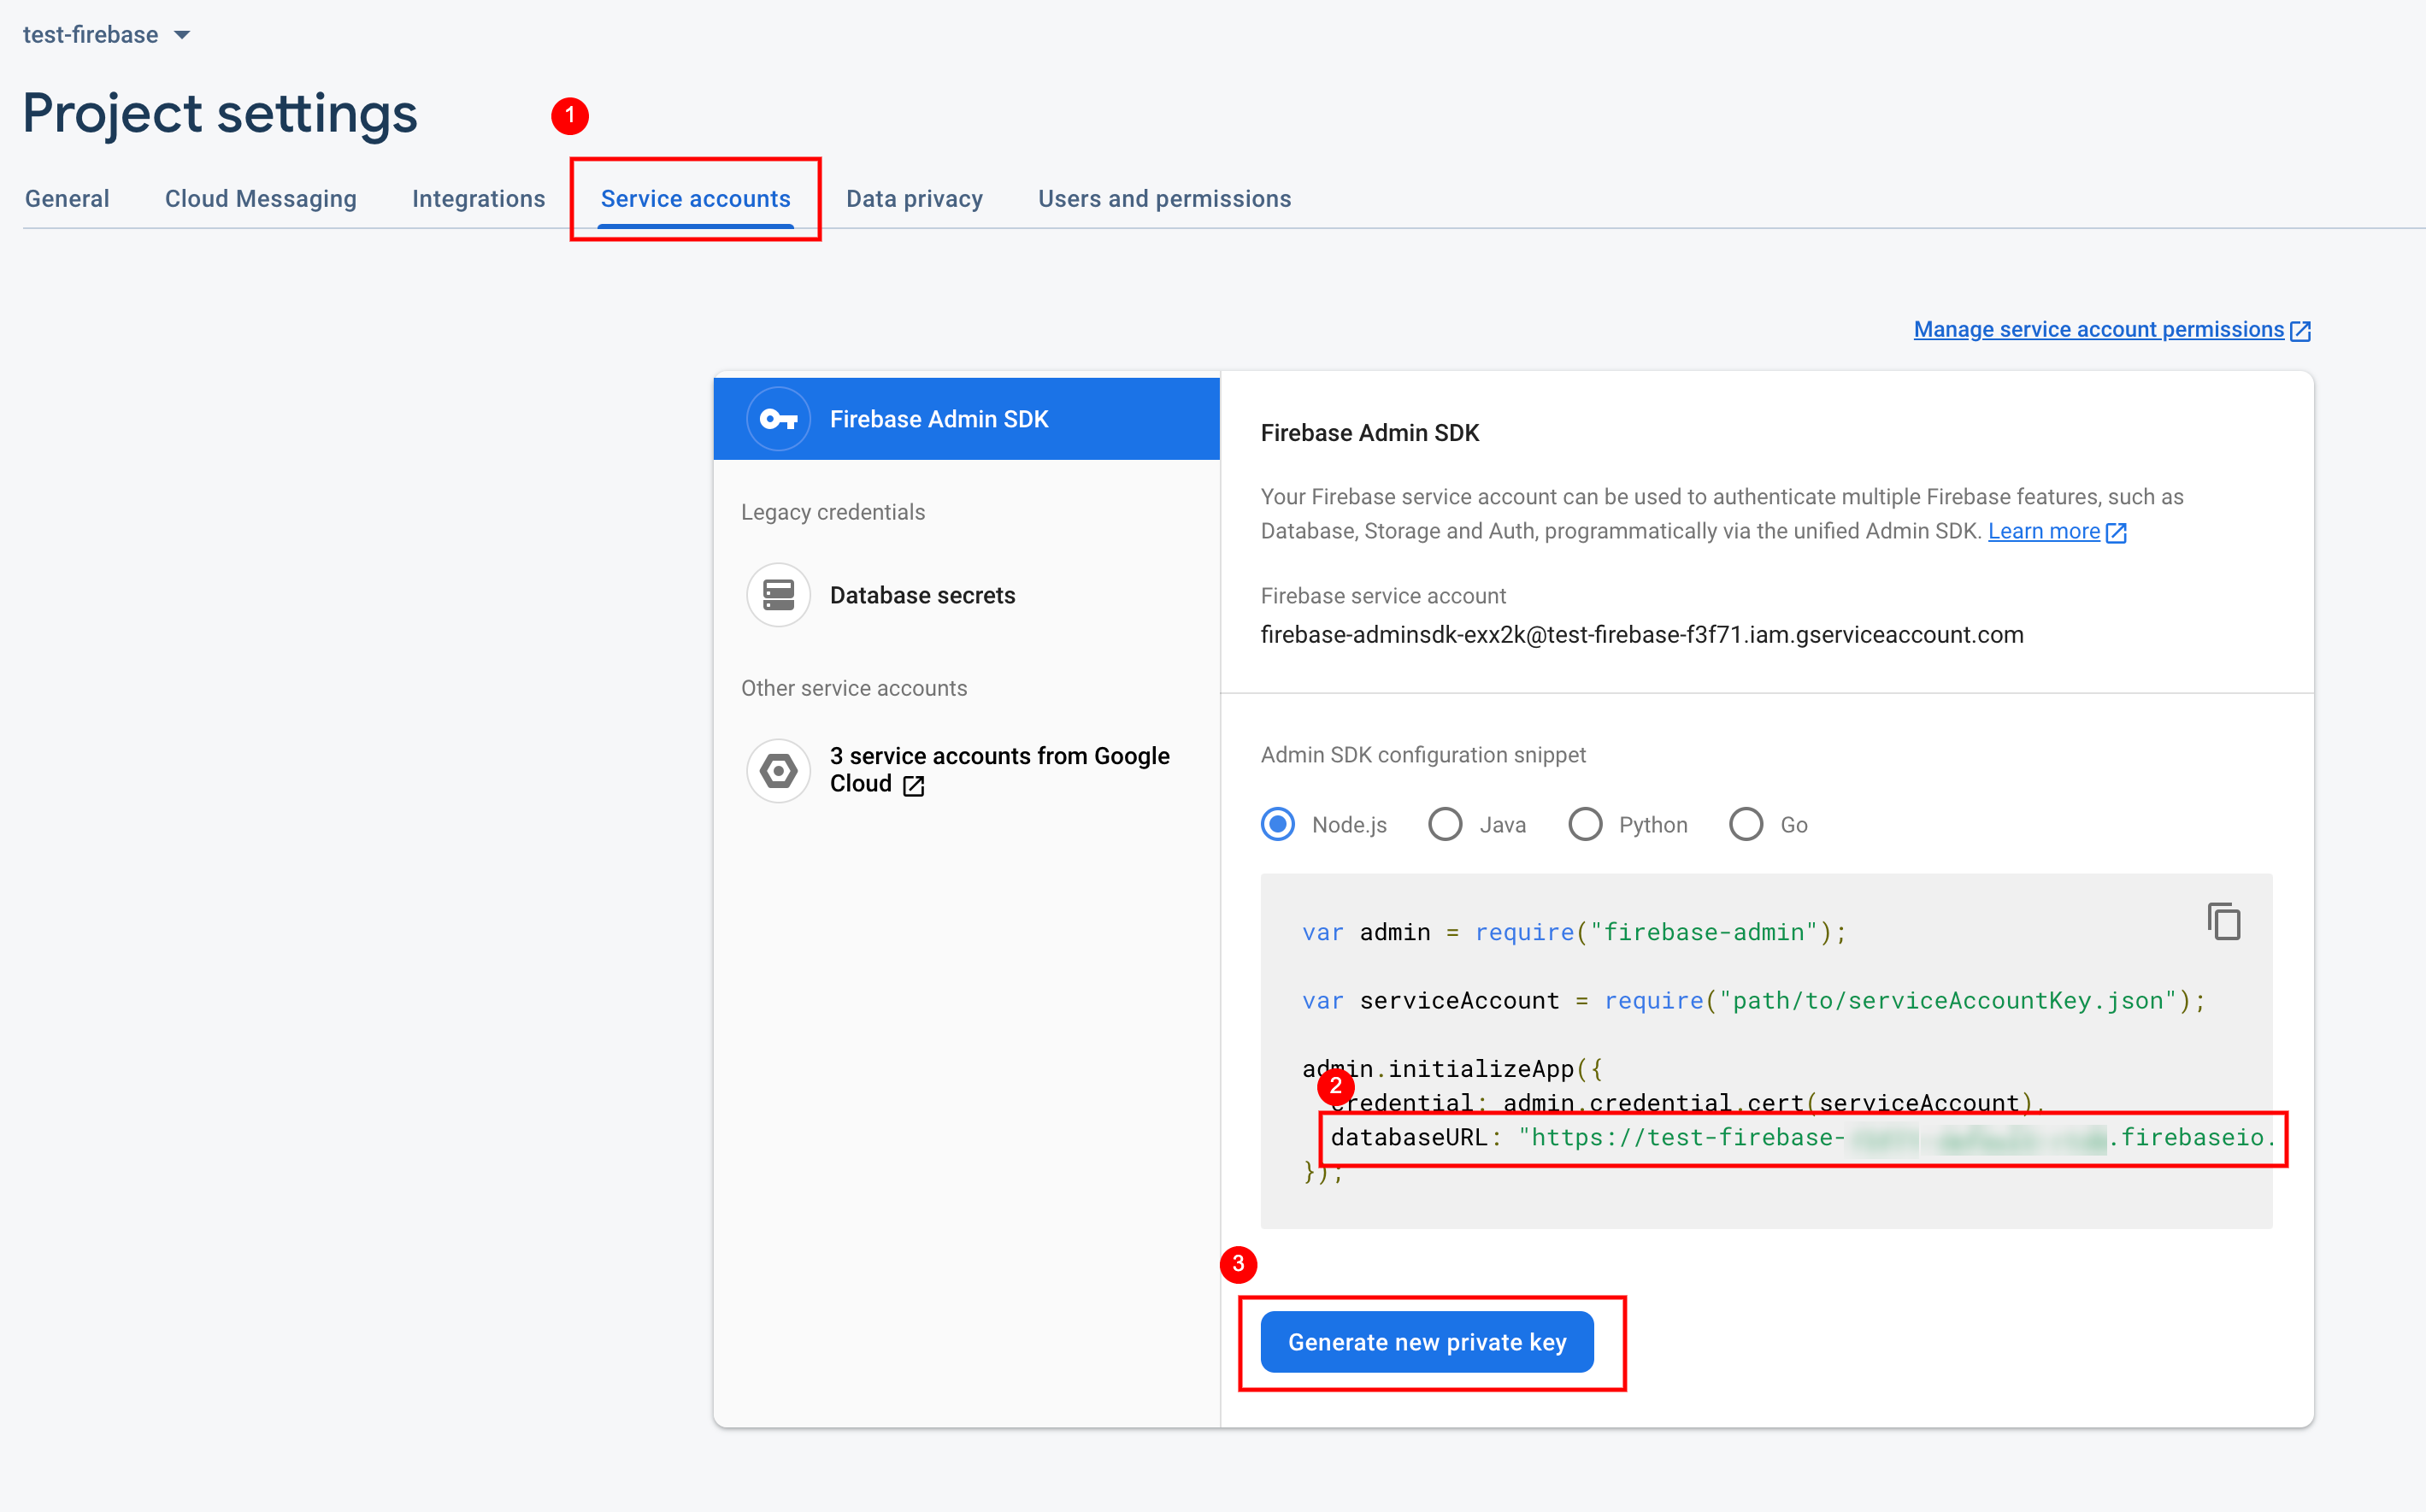
Select “Set Project” from the cog icon, then select the service account tab.
From the Firebase Admin SDK field, take note of the value for databaseURL, then click “Generate new private key”. The JSON file will download.
Use a text editor to open the downloaded private key.
databaseURL will be used in the Flow.
Inputs in Flow
Double click the firebase node and click on the pencil icon to edit a new firebase.
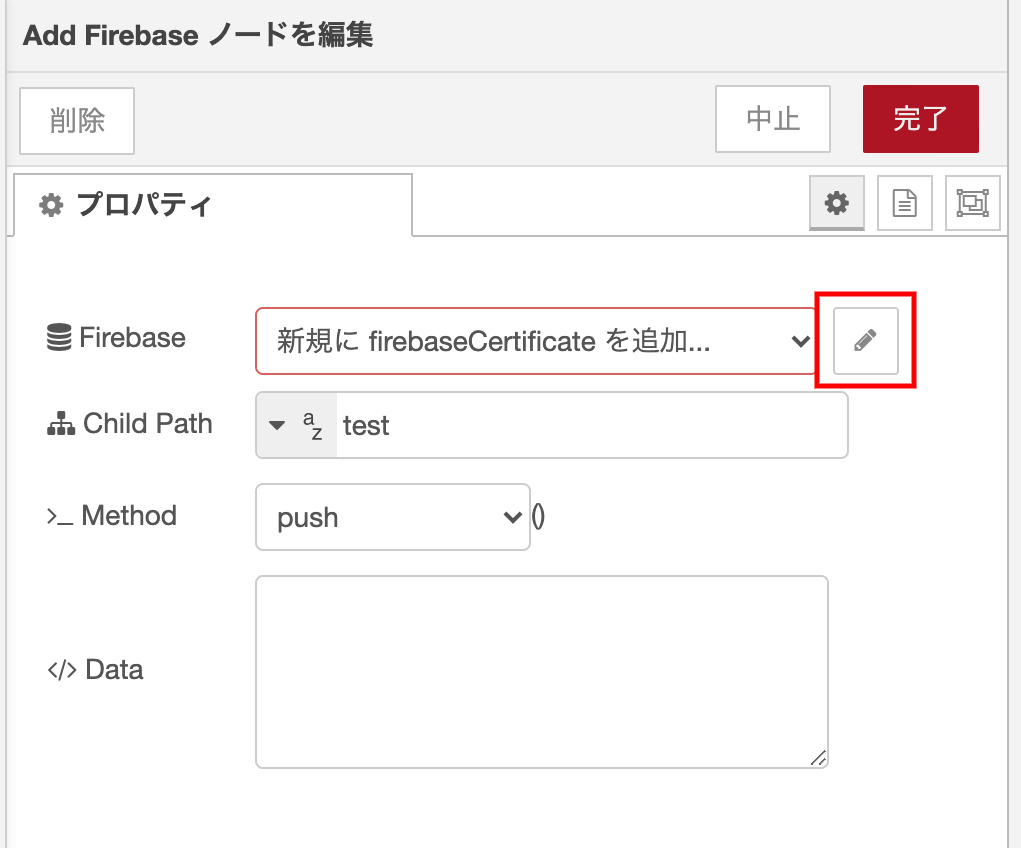
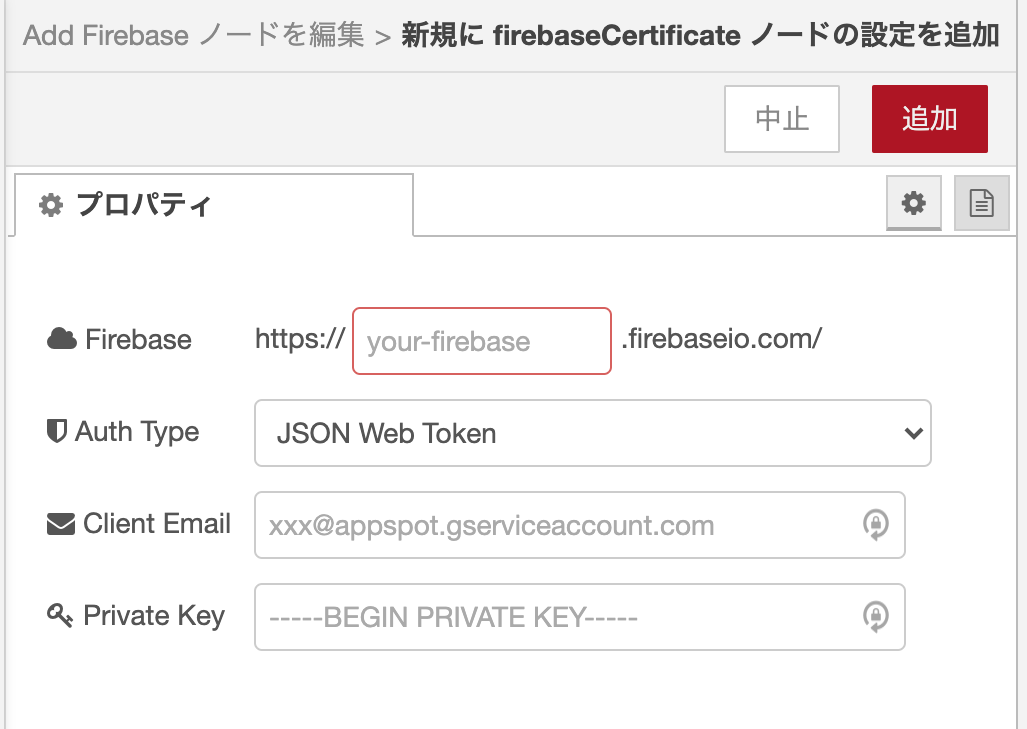
In the Firebase field, enter only the application name from the previously noted databaseURL.
Select JSON Web Token for AuthType.
The Client Email and Private Key fields are displayed. From the private key file, copy the “values for private_key” and “cleint_email” and paste them into the fields.
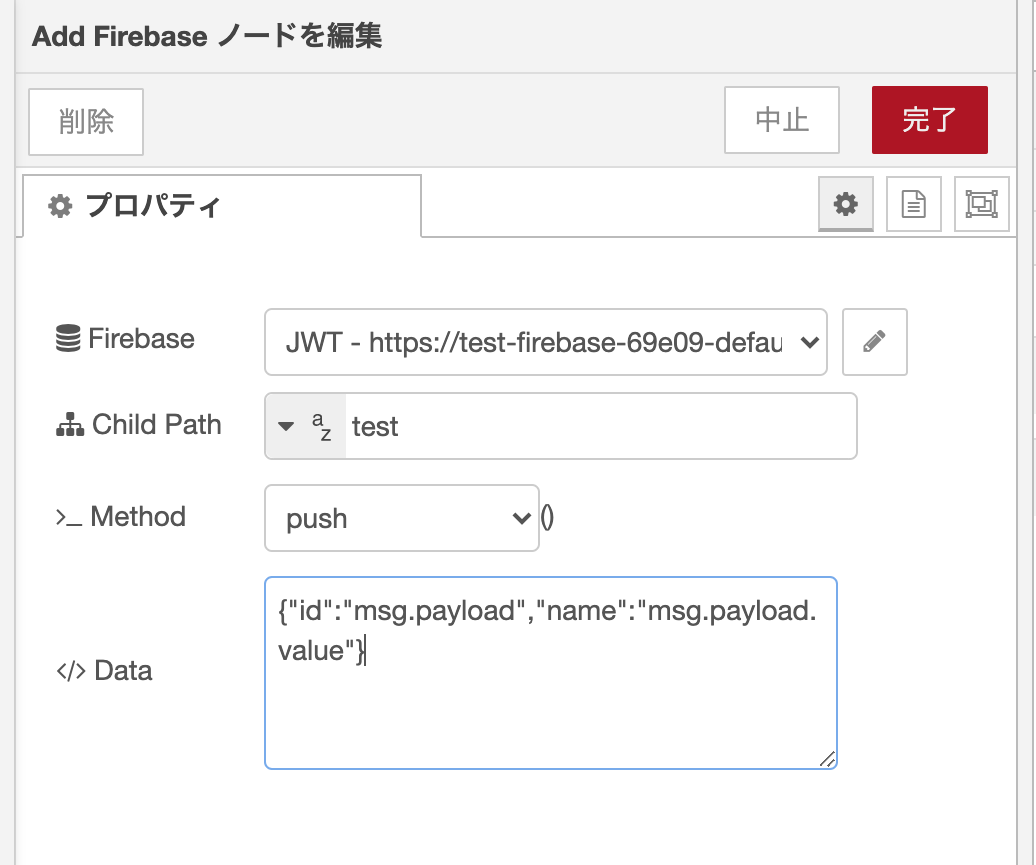
Click the “Add” button and return to the Add Firebase Node edit screen, select Firebase‘s URL from the list of Firebase property fields.
Enter test in the Client Path and select Push for the Method
Copy the following codes and paste them into Data fields, then click the Done button.
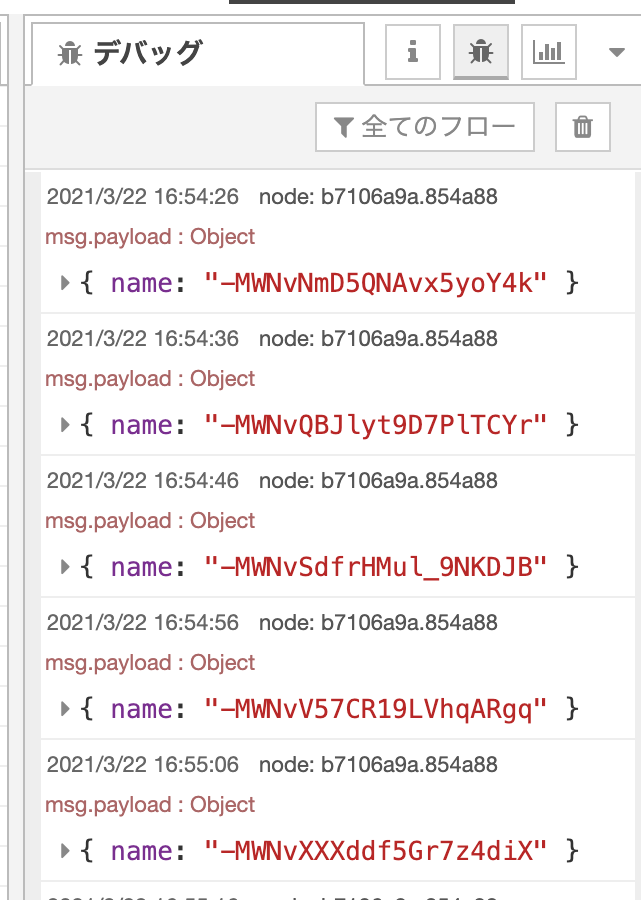
Once the correct credentials are inserted click the Deploy button. To check if data is being pushed click the debug tag.
The debug log should be updated every 10 seconds (intervals set by the inject node).
Image of debug log
With data being pushed to a database we can create an datasource (endpoint) for infomotion to use.
*Note 1: The free version of enebular automatically sleeps if there is no access for 30 minutes. At present only the free version is available.
*Note 2: If the flow editor is left open and unused for an extended period of time, an attempt to deploy may result with it failing with "Unauthorized". If this happens please reload.
Registering a DataSource for InfoMotion
We will next add datasources to our project for InfoMotion to visualise. At your project dashboard select Data Source on the left tab then click on the plus button to open the datasource modal.
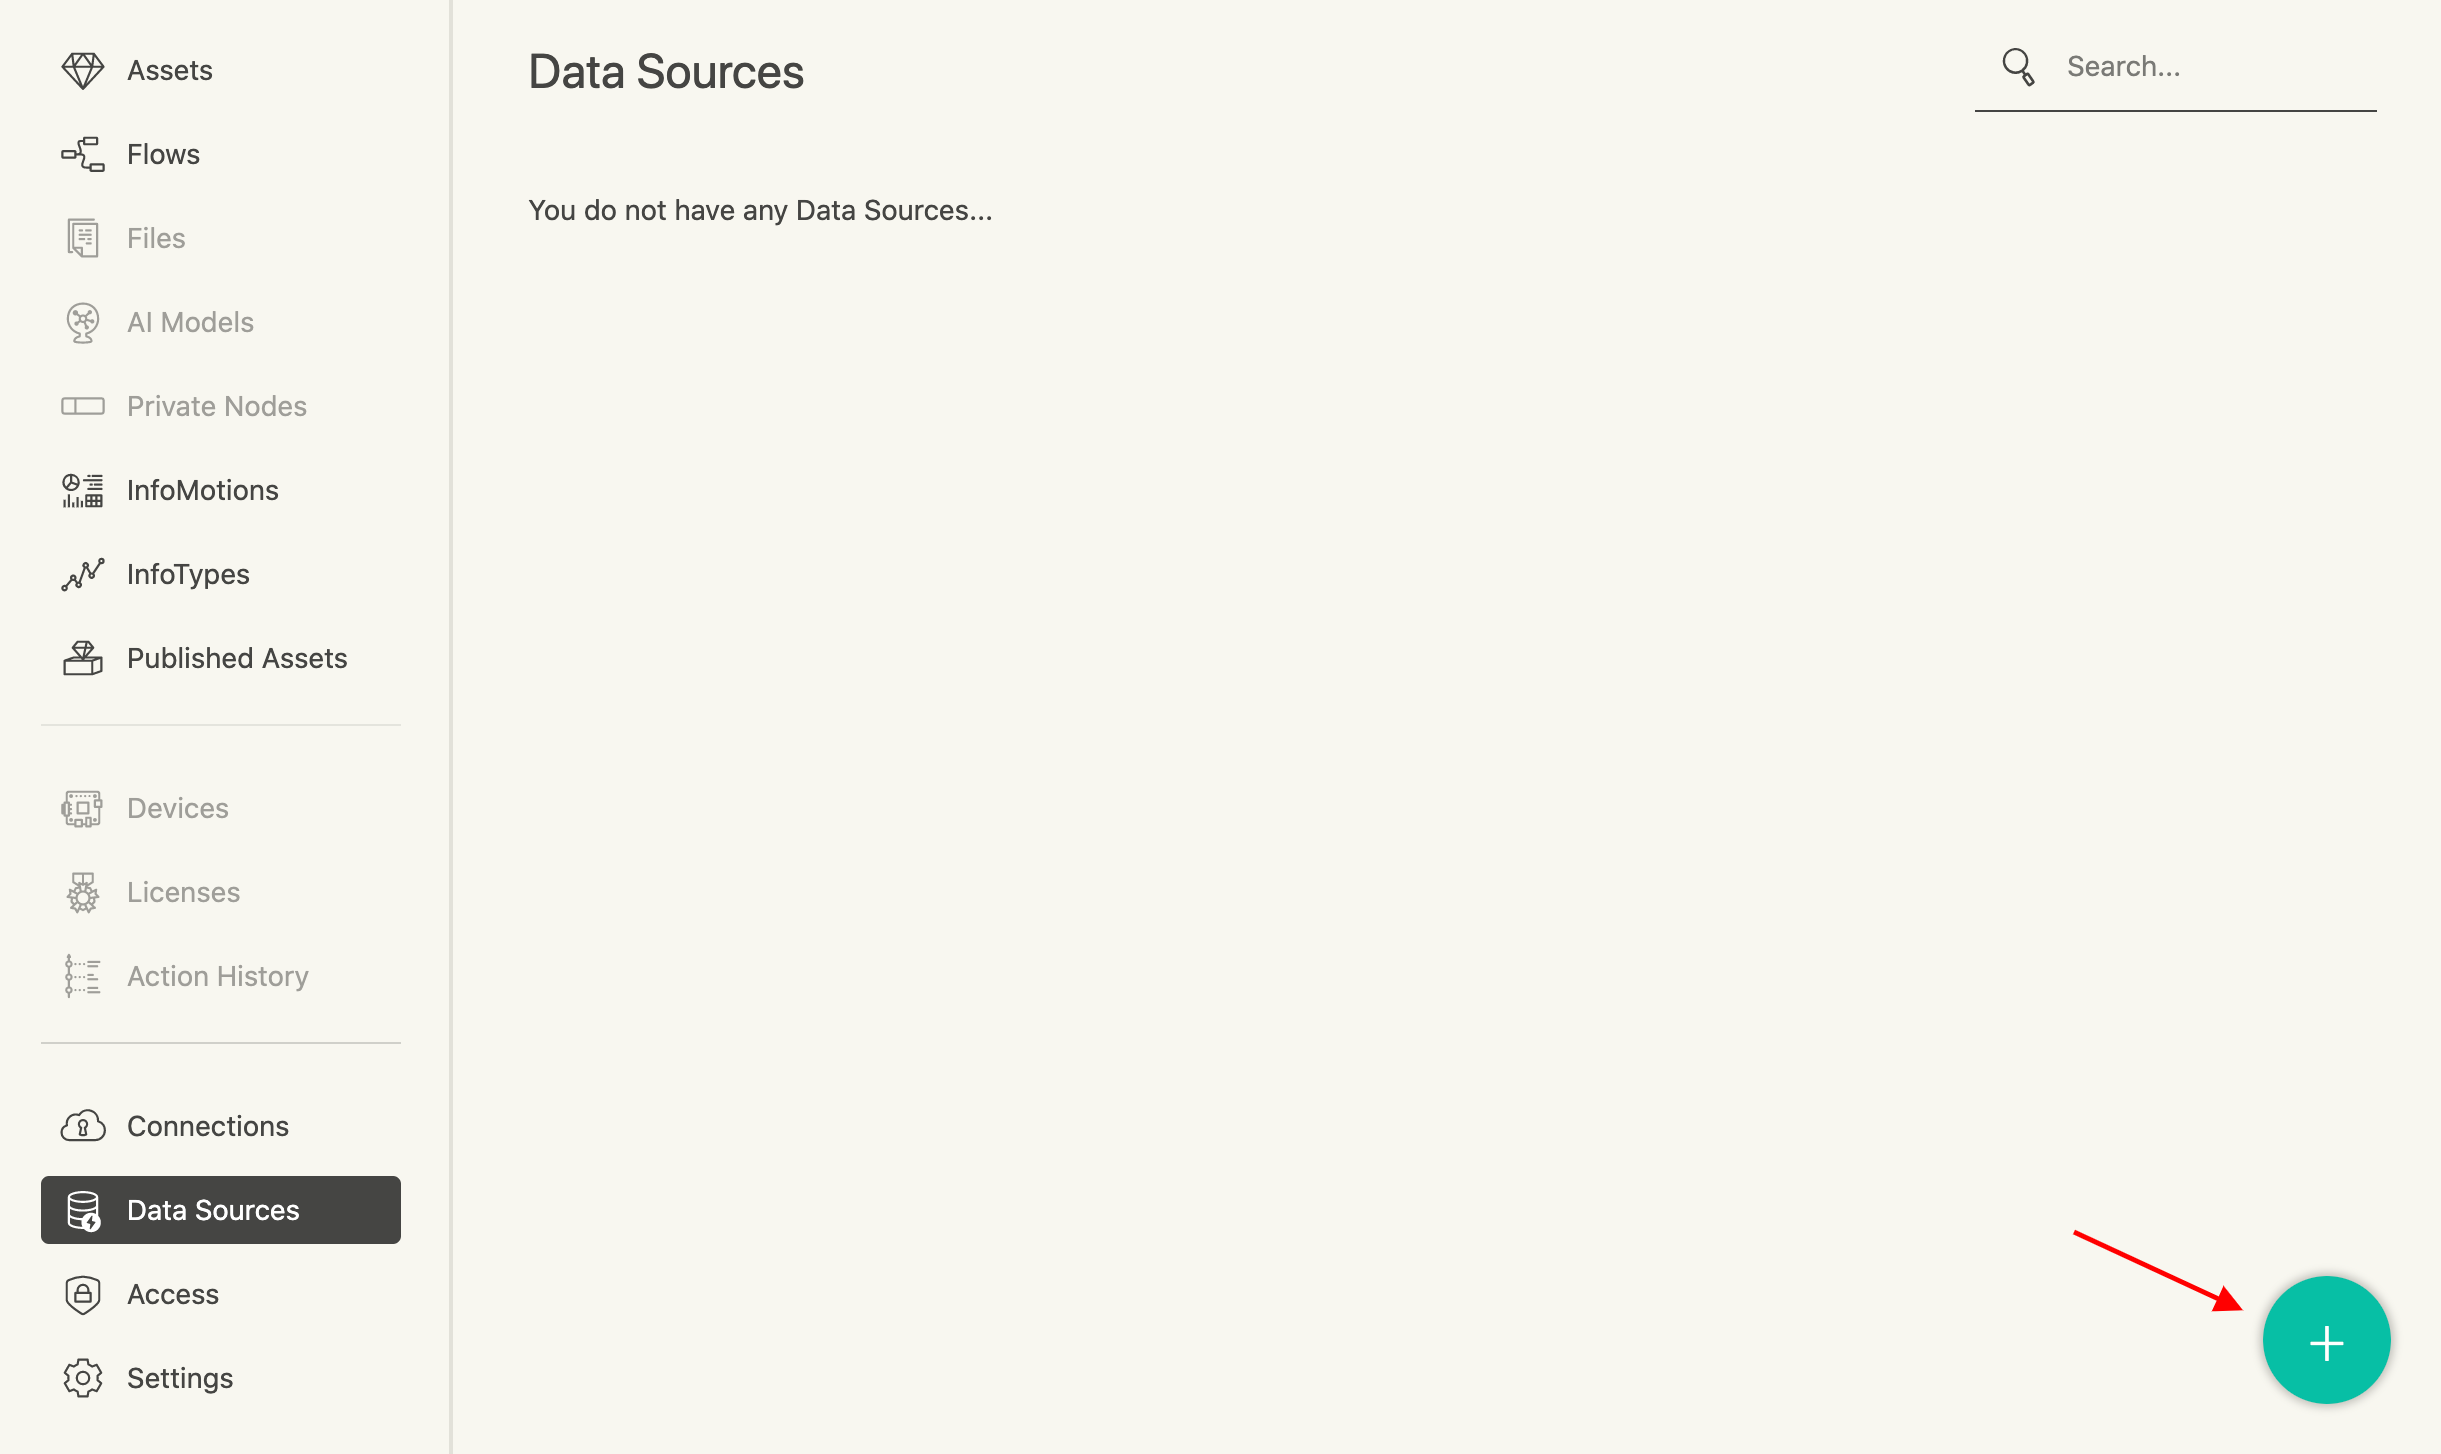
Enter any name in Title and select [Firebase] from DataSourceType to open the Data Source Settings screen.
In order to acquire the necessary values, move to the Firebase management screen, choose Set project from the cog icon and open the General tab.
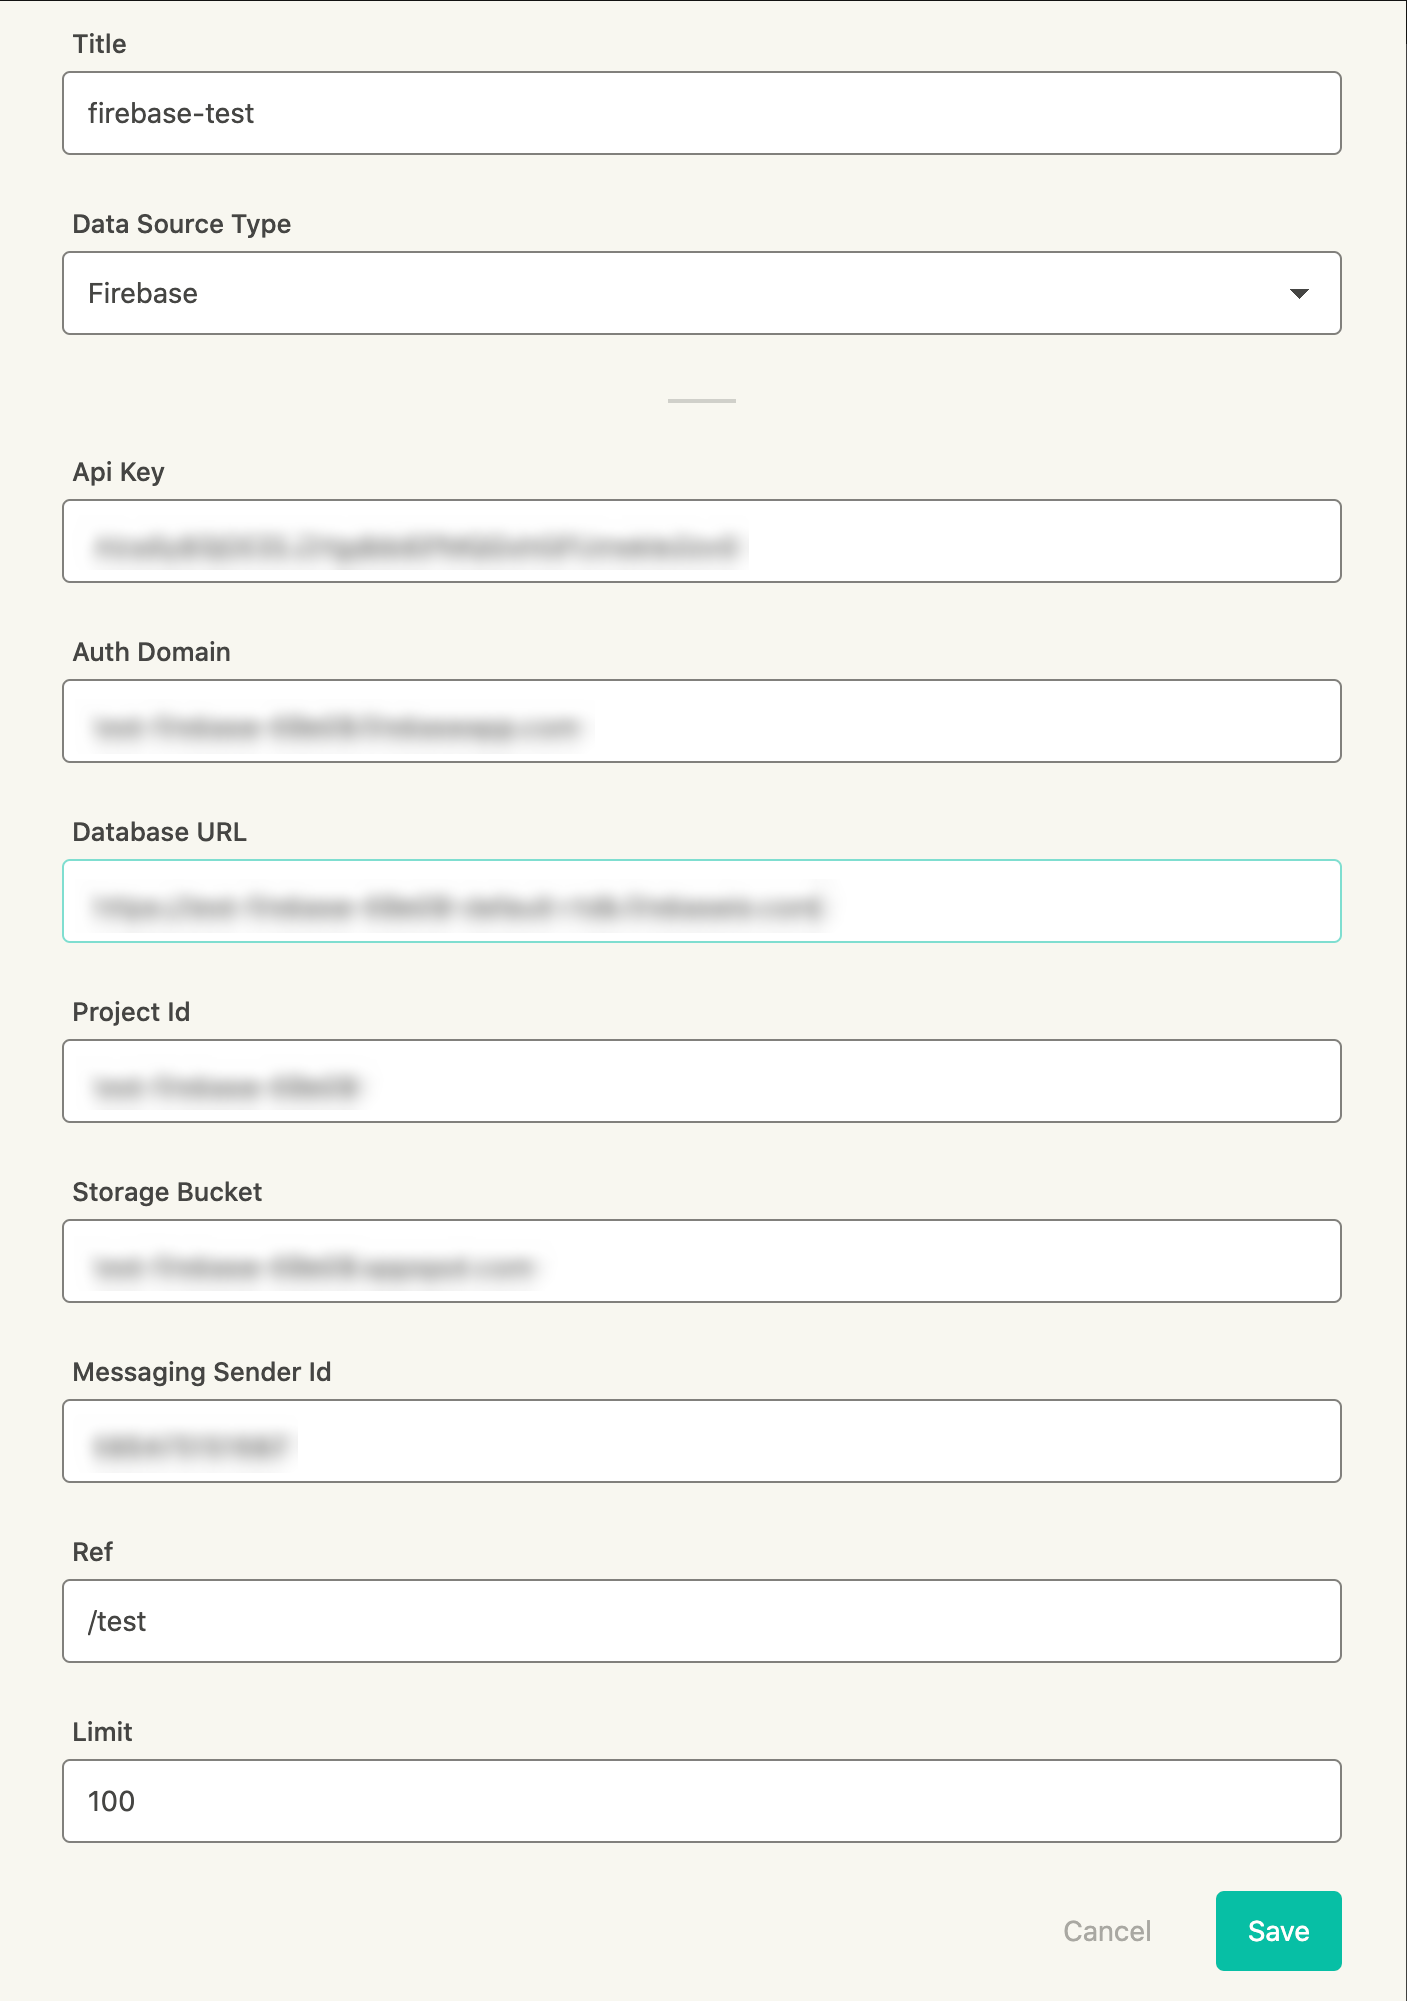
In the Your apps field, reference the script in Firebase SDK snippet in the Application name that was previously created, enter the values corresponding to the following items in the Data Source Settings screen and click the Save button.
For
Database URL, enter the contents of the note created as part of theAcquire private keytask.Api Key
- Auth Domain
- Database URL
- Project Id
- Storage Bucket
- Messaging Sender Id
Enter the Child path used when creating the flow in Ref. (In Firebase, this is called Collection Name).
Since Ref requires a /(slash) in front, set its value to “/test”Limit can be left as the default value.
This completes the data source settings. InfoMotion can now be used.
Import an InfoType
An enebular user can publish Assets or import published Assets.
Explanation of the procedure for importing a published InfoType.
Click on Discover on the upper right.
Select Infotype as the Asset type and enter “bar-chart” in the search bar.
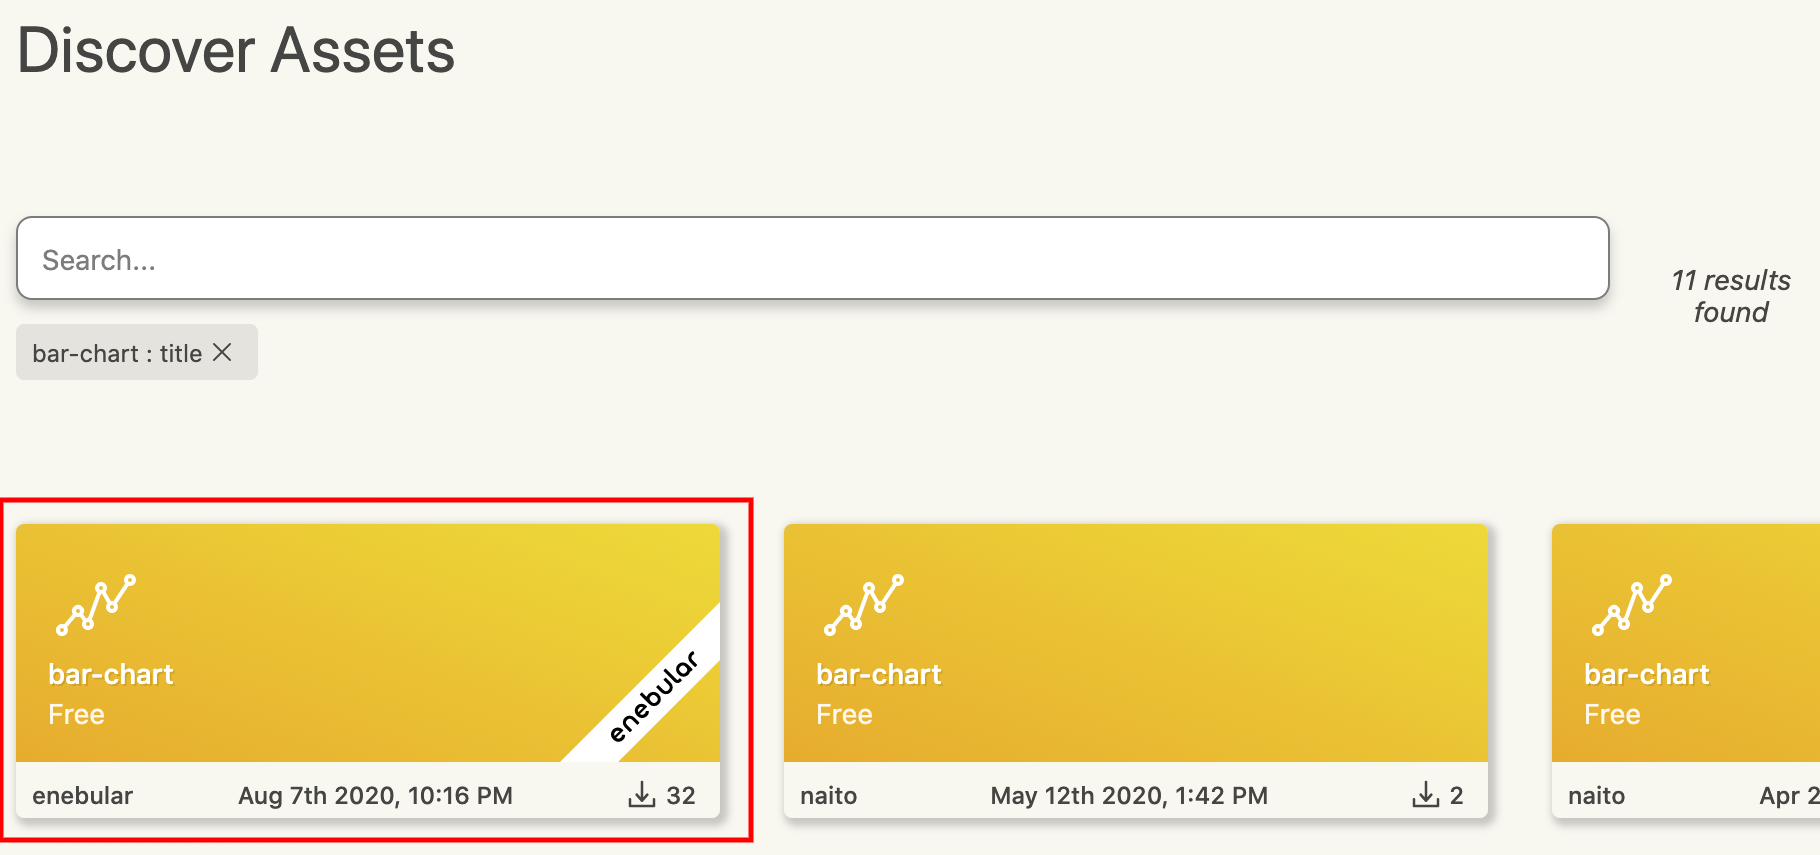
Click import (marked by enebular) to open the import modal.
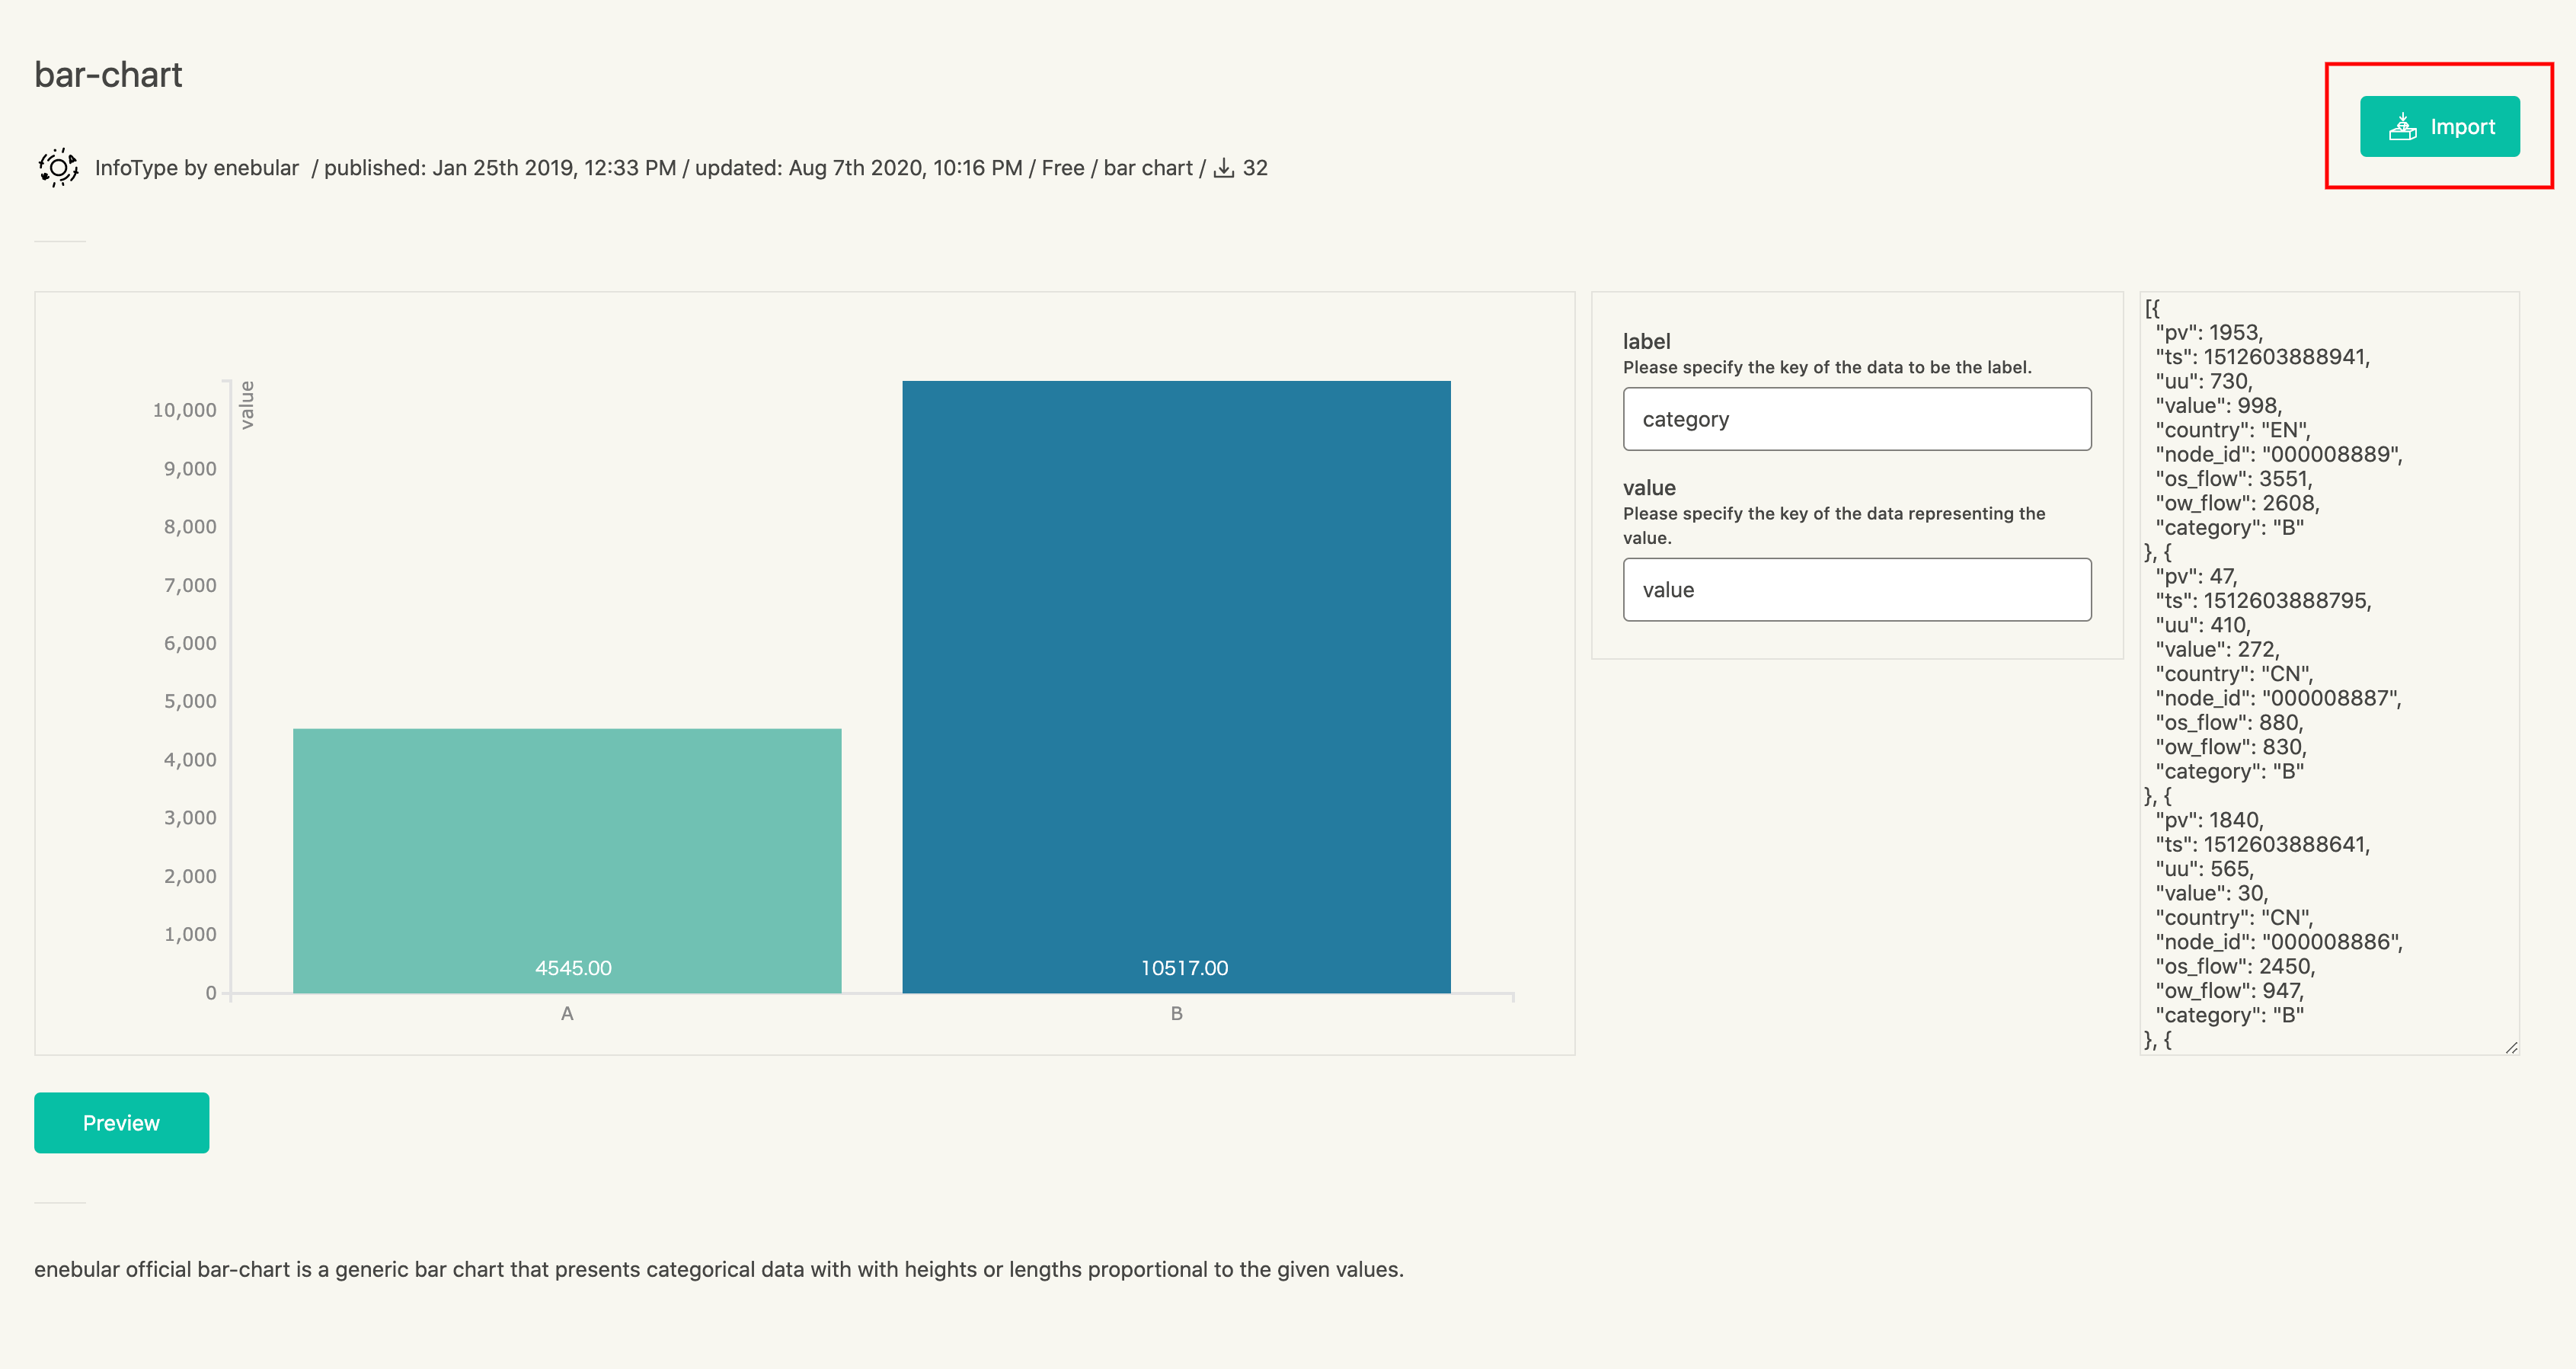
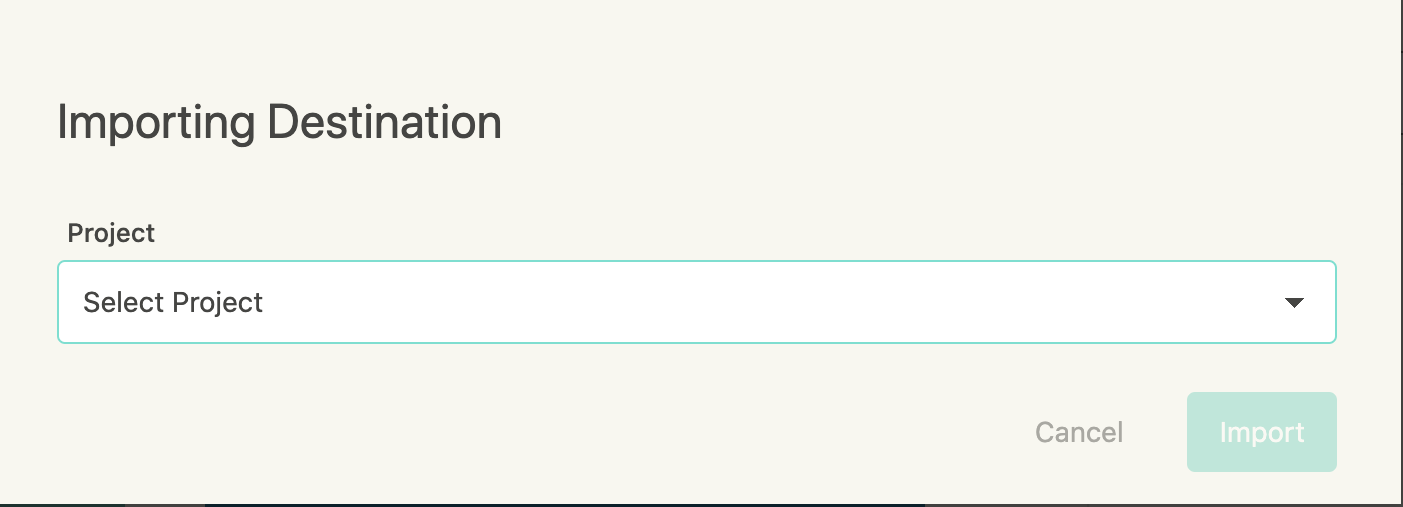
Select the project to import and click the Import button.
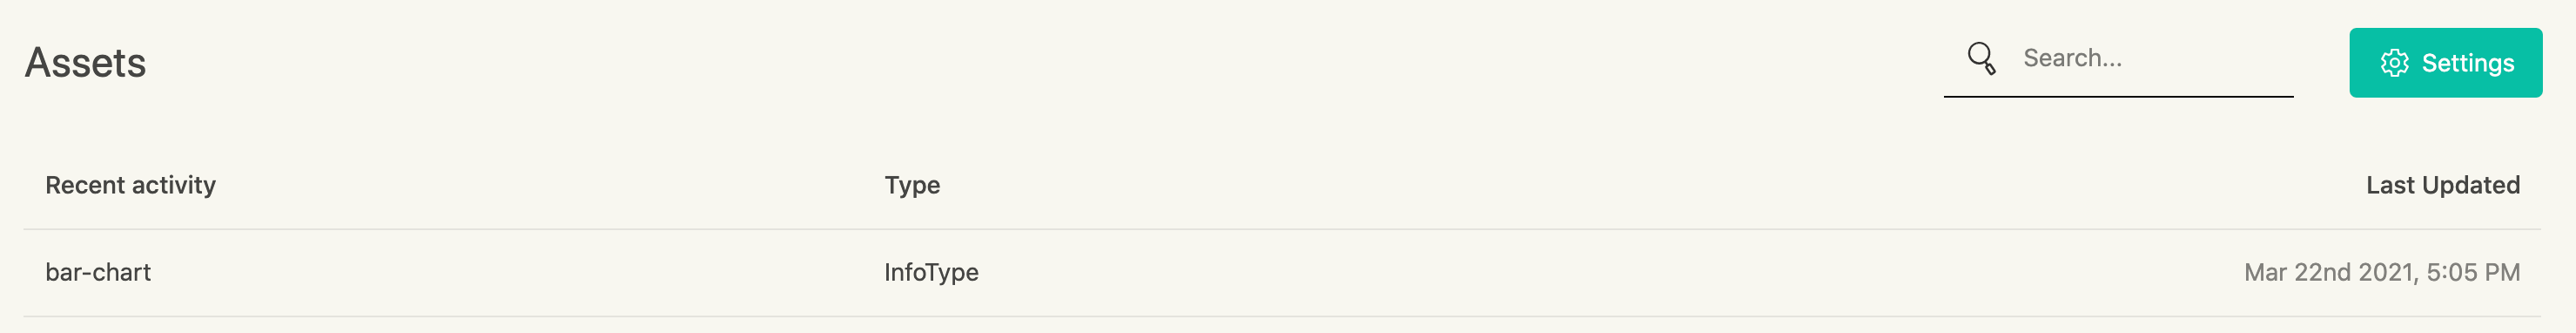
From the Project Dashboard, Confirm that the installed InfoType has been added.
Creating an InfoMotion
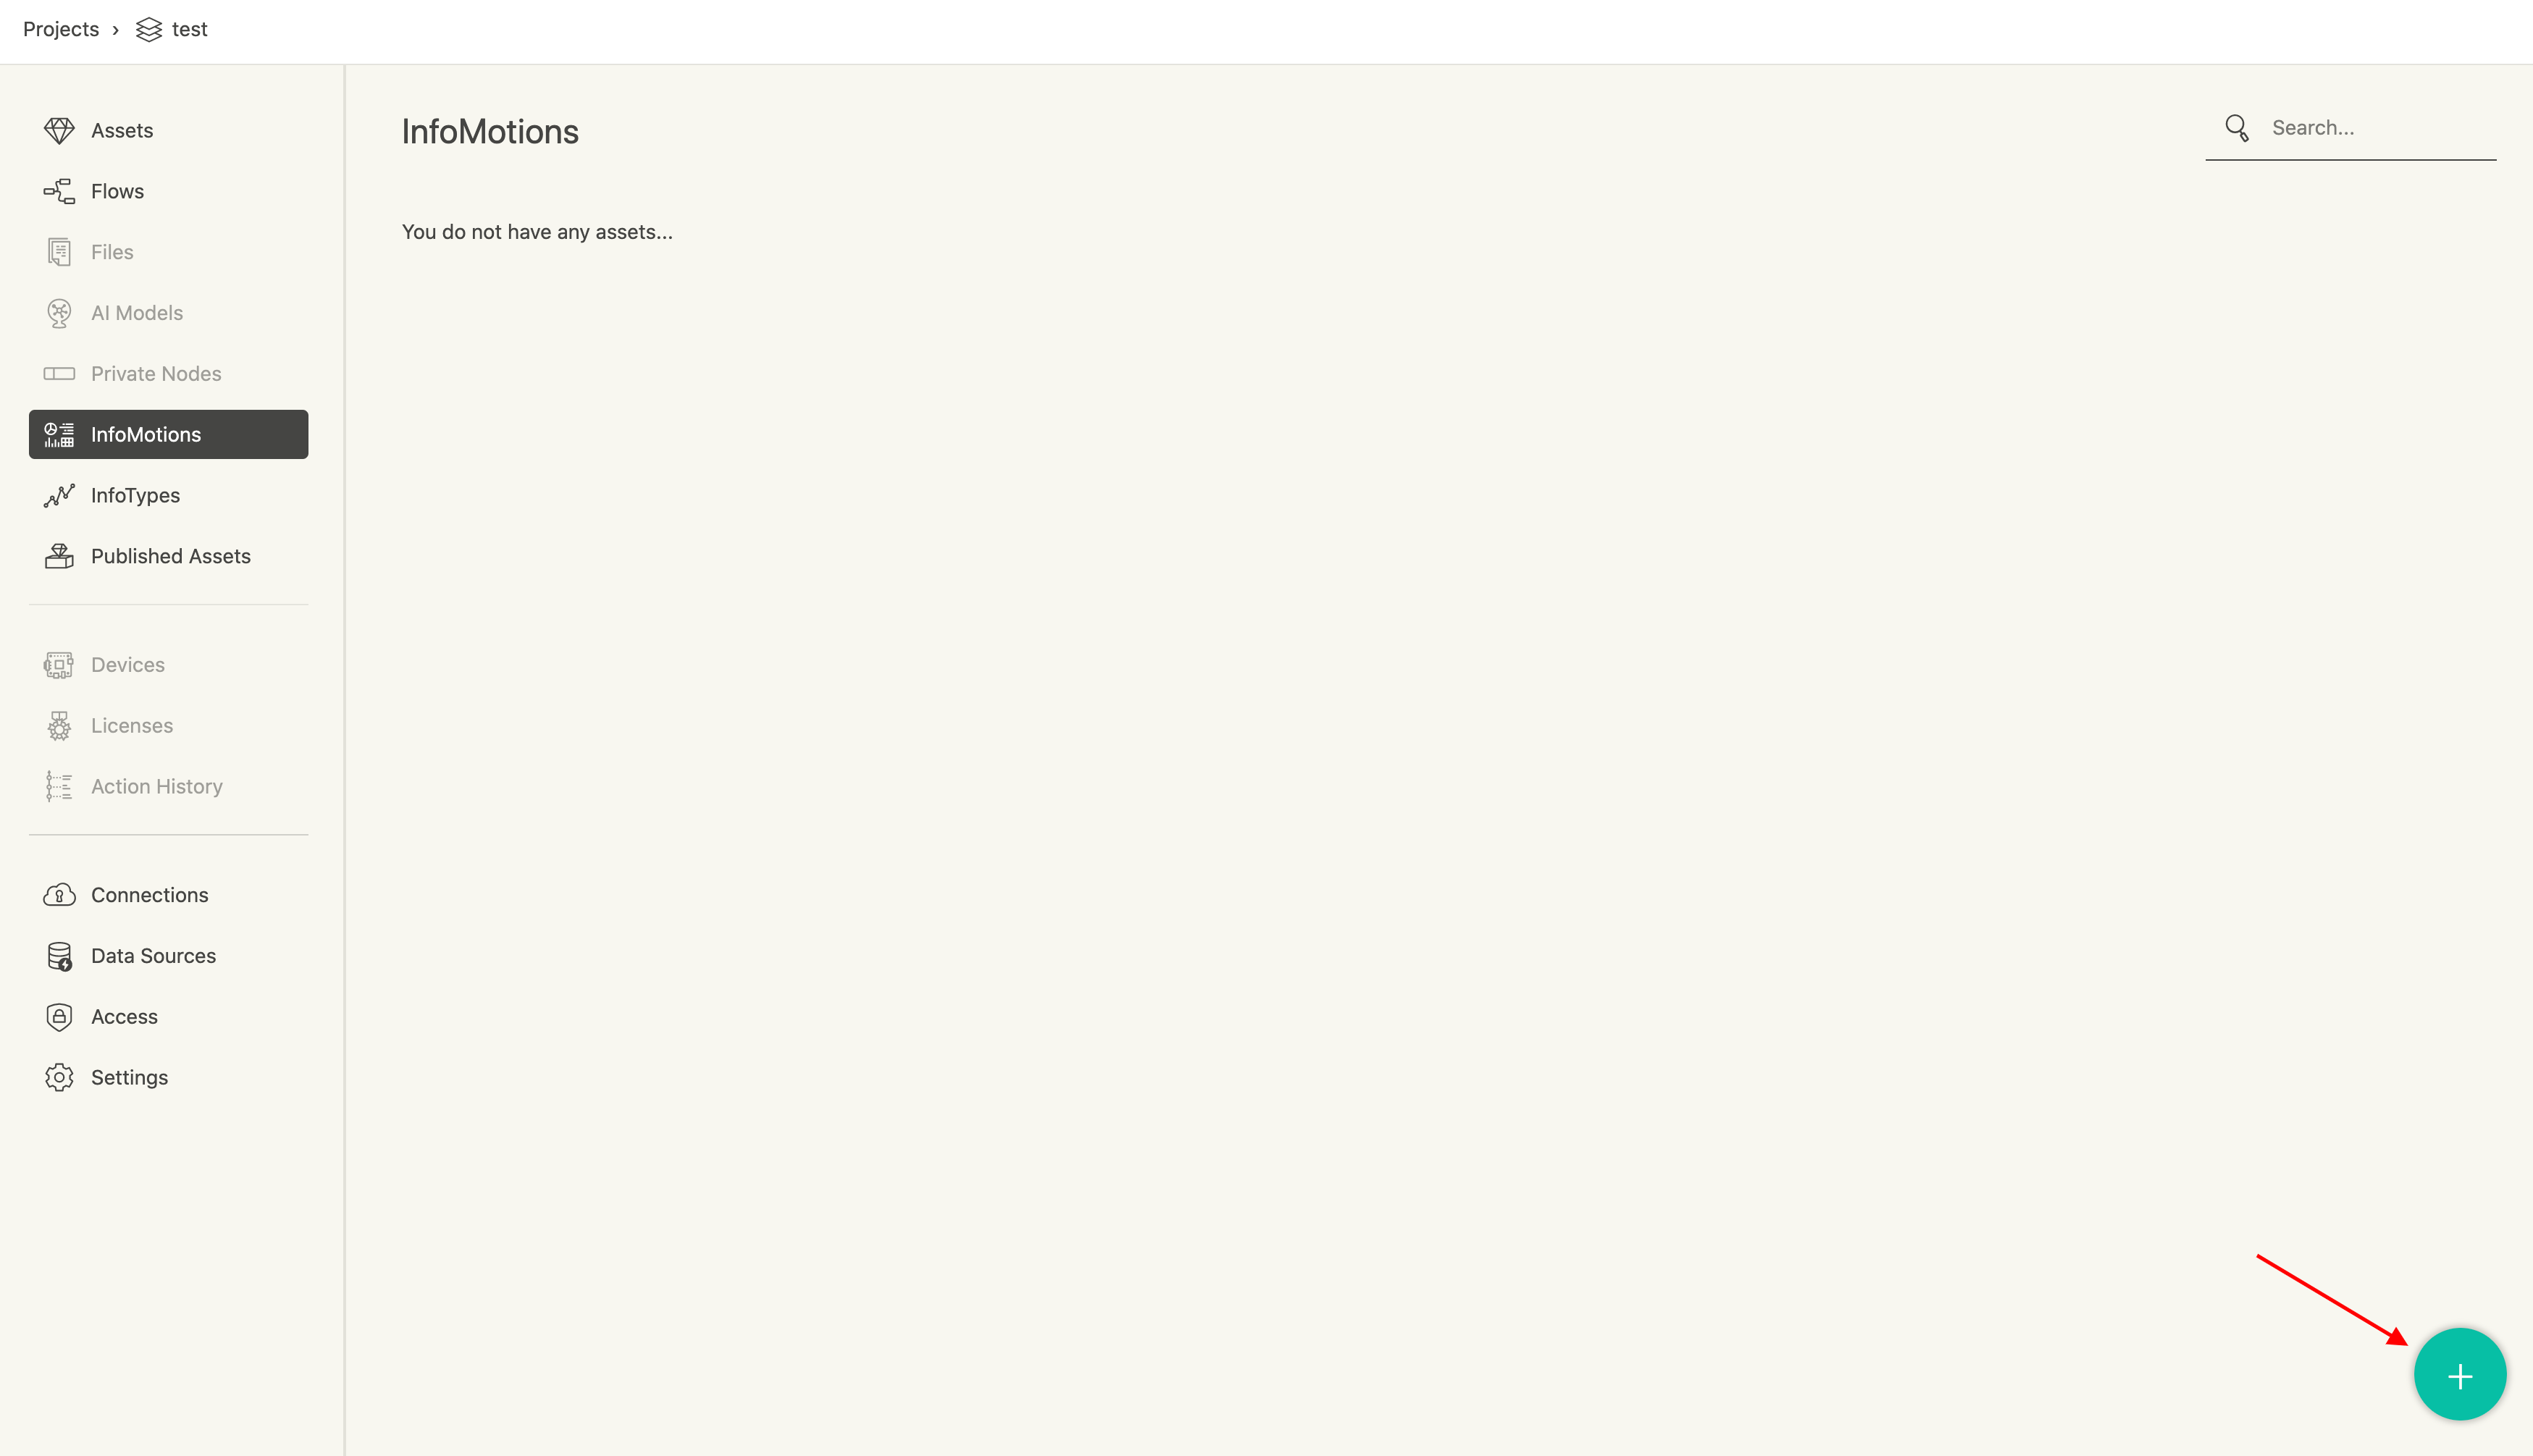
Here we'll create an InfoMotion using a DataSource and an InfoType. Press the "+" at the bottom right to open the dialog box.
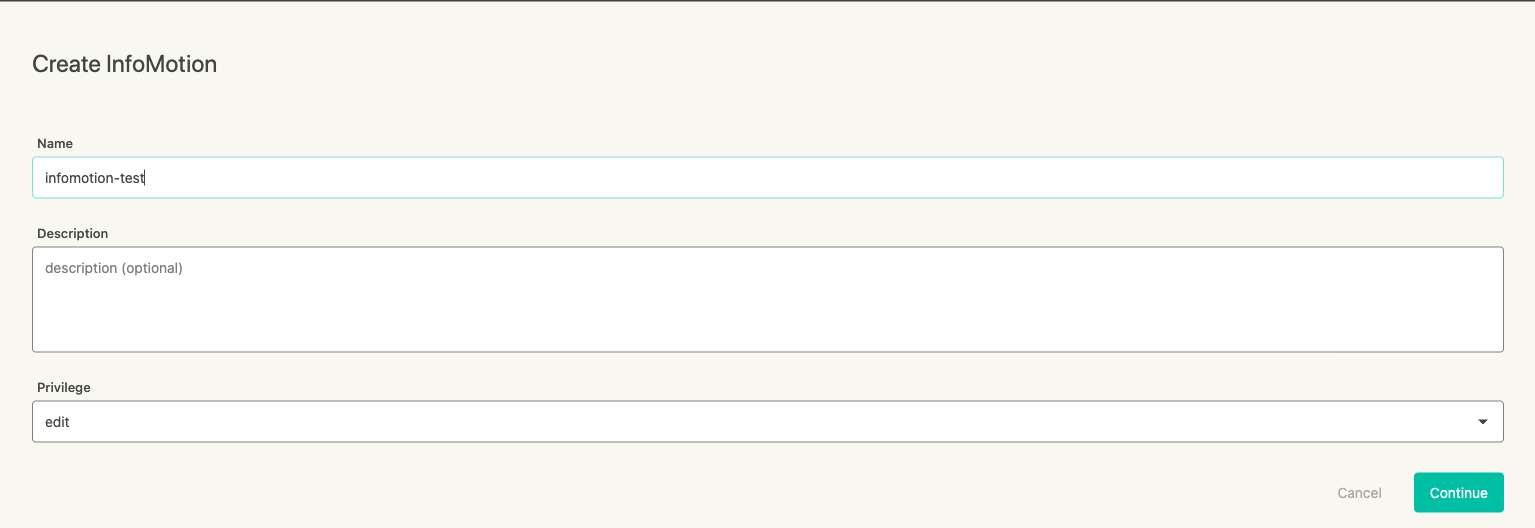
Enter an optional name and leave the access privilege as default.
Once you've created it you'll be taken to the InfoMotion dashboard screen.
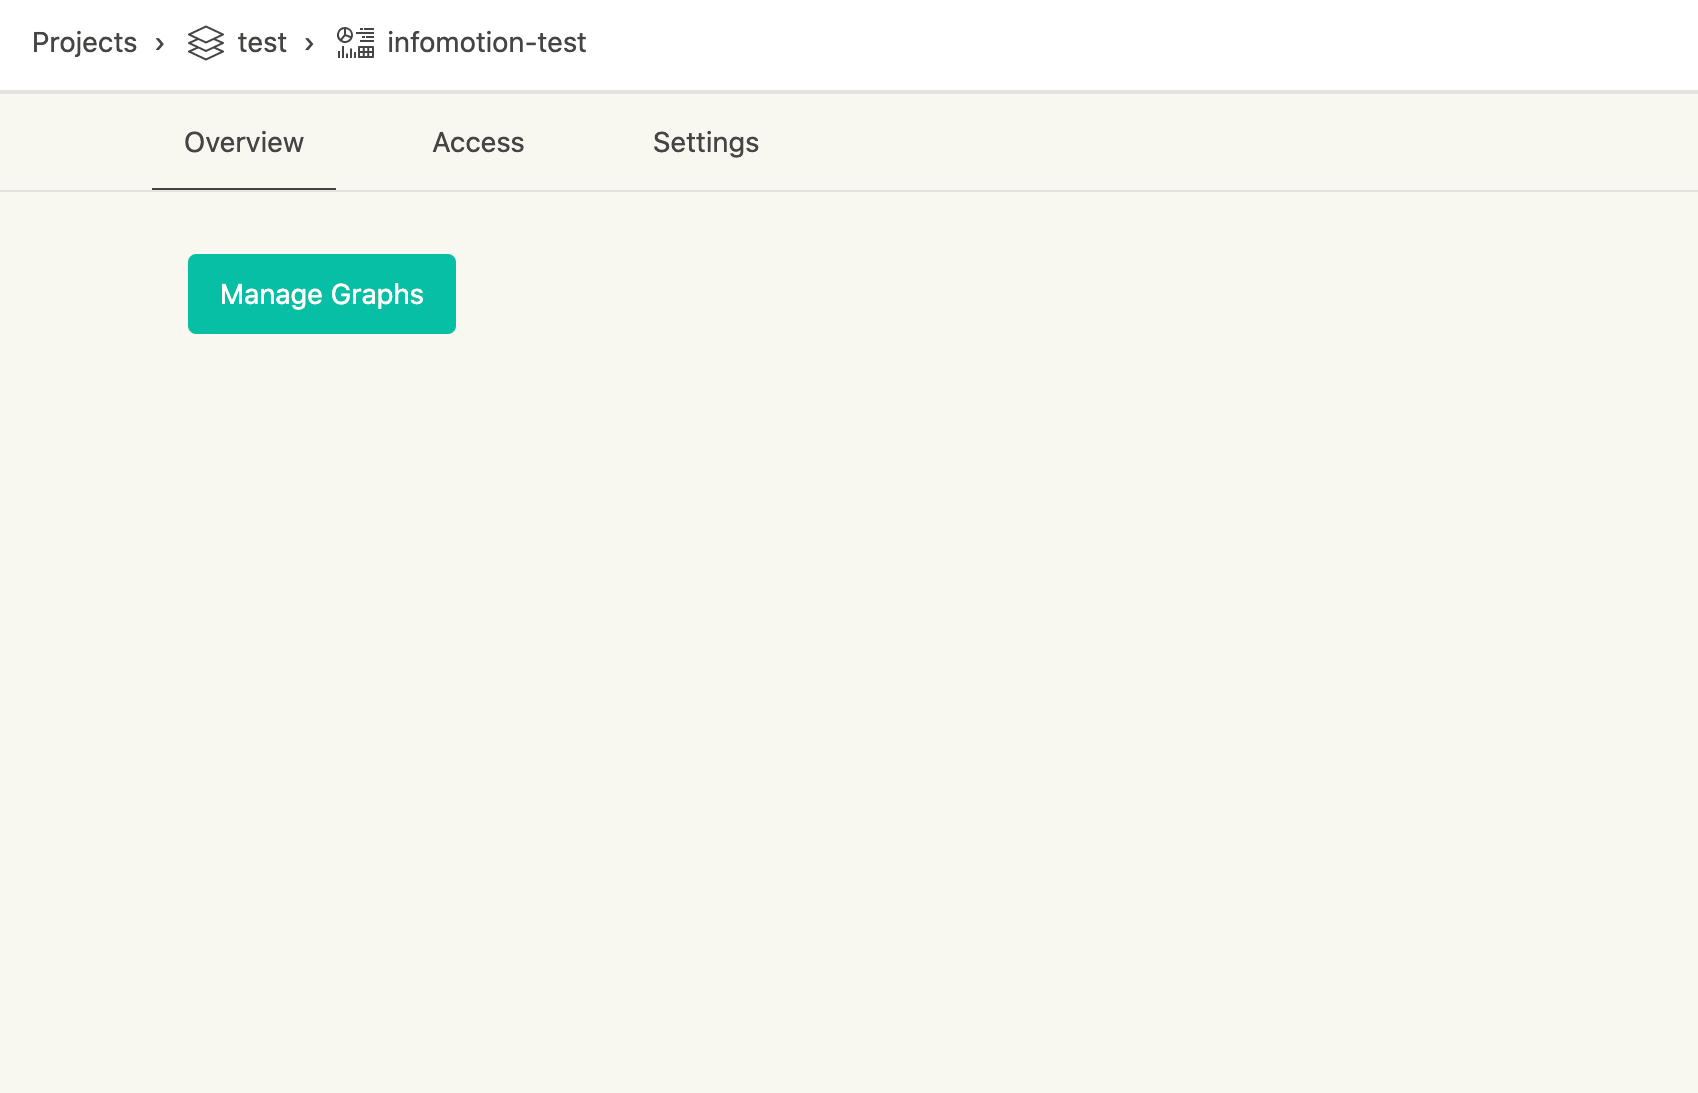
Open the sidebar with "Manage Graphs". A list of the graphs shown on the dashboard is shown in the sidebar. In this procjet no graphs have been added yet.
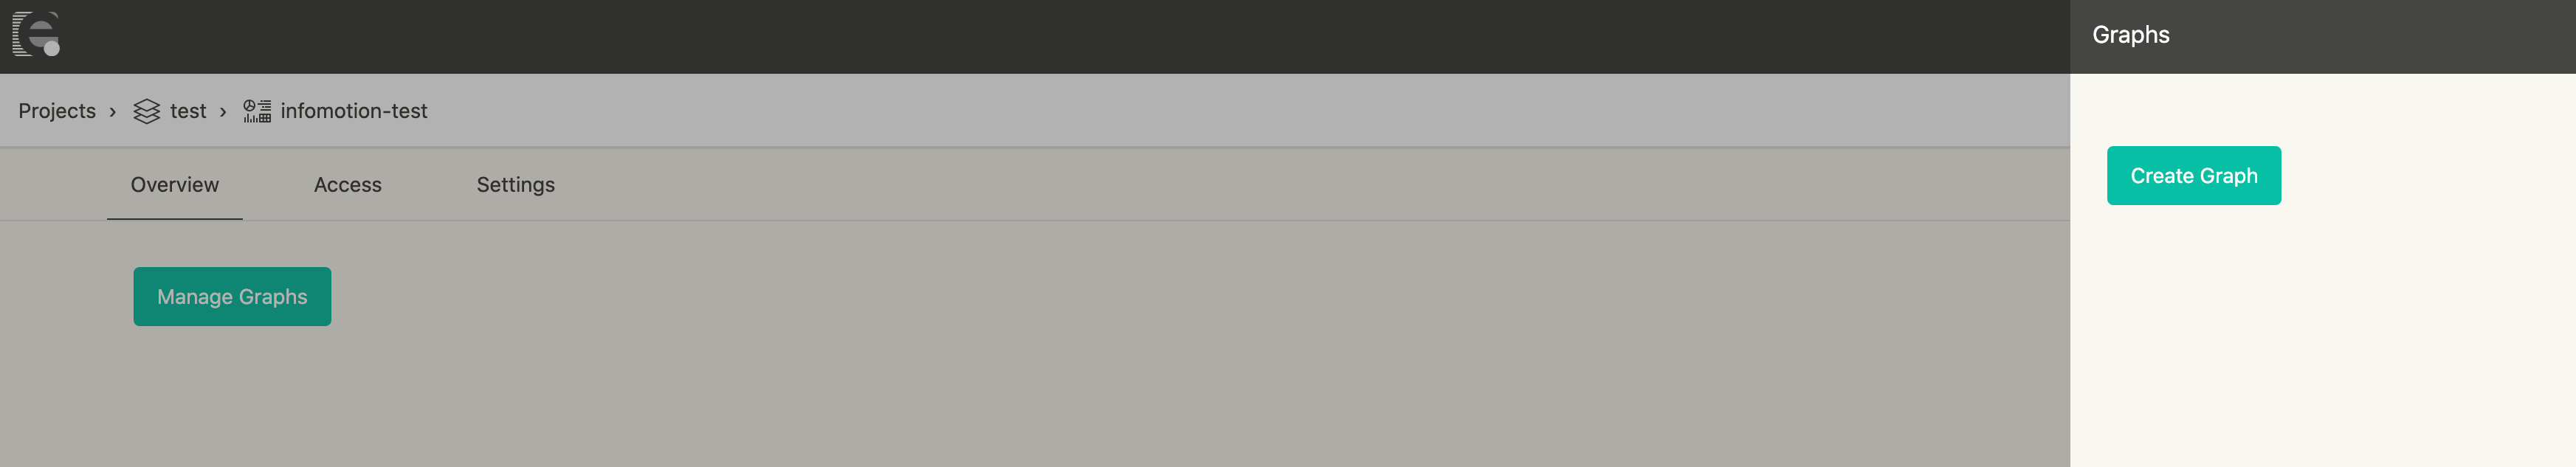
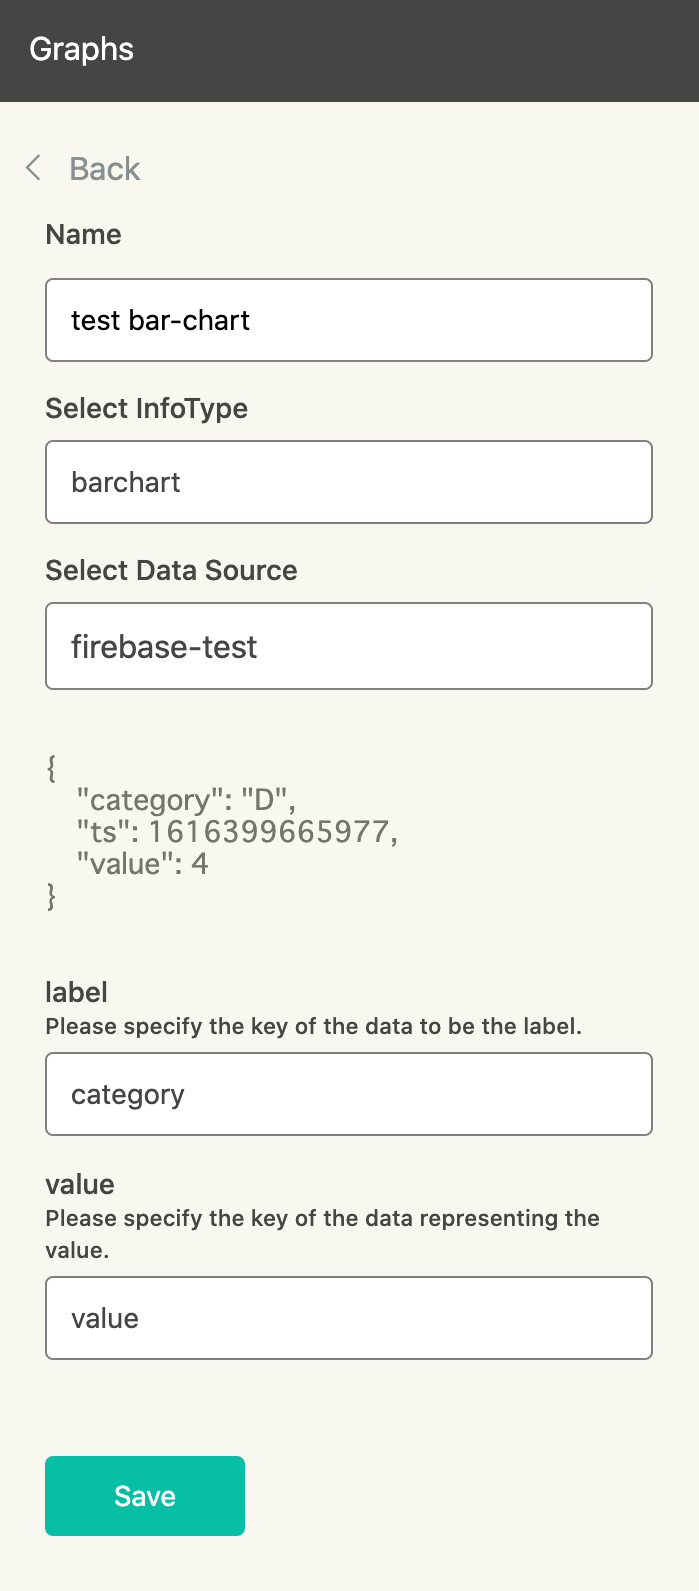
Click on Create Graph to open the the creation modal.
By default the Type will be set to barchart and DATASOURCE to test-datasource.
The Label corresponds to x axis set as category and Value to the y axis value. These are set by default.
Edit the name as you like then Save.
The created graph will now be added to the list.
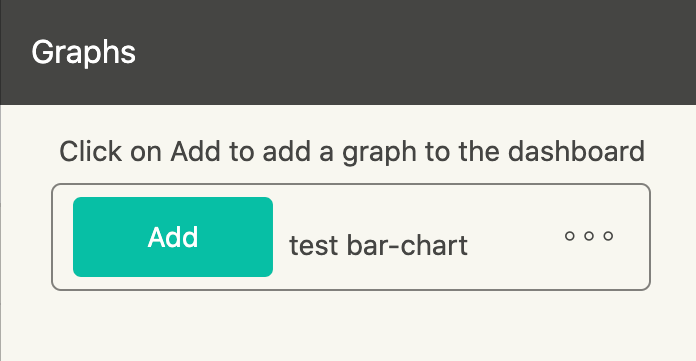
If you click the Add to the left of the graph name it will be added to the dashboard. If data is not displayed you may have no data being stored. Select a daterange to a date when data was stored.
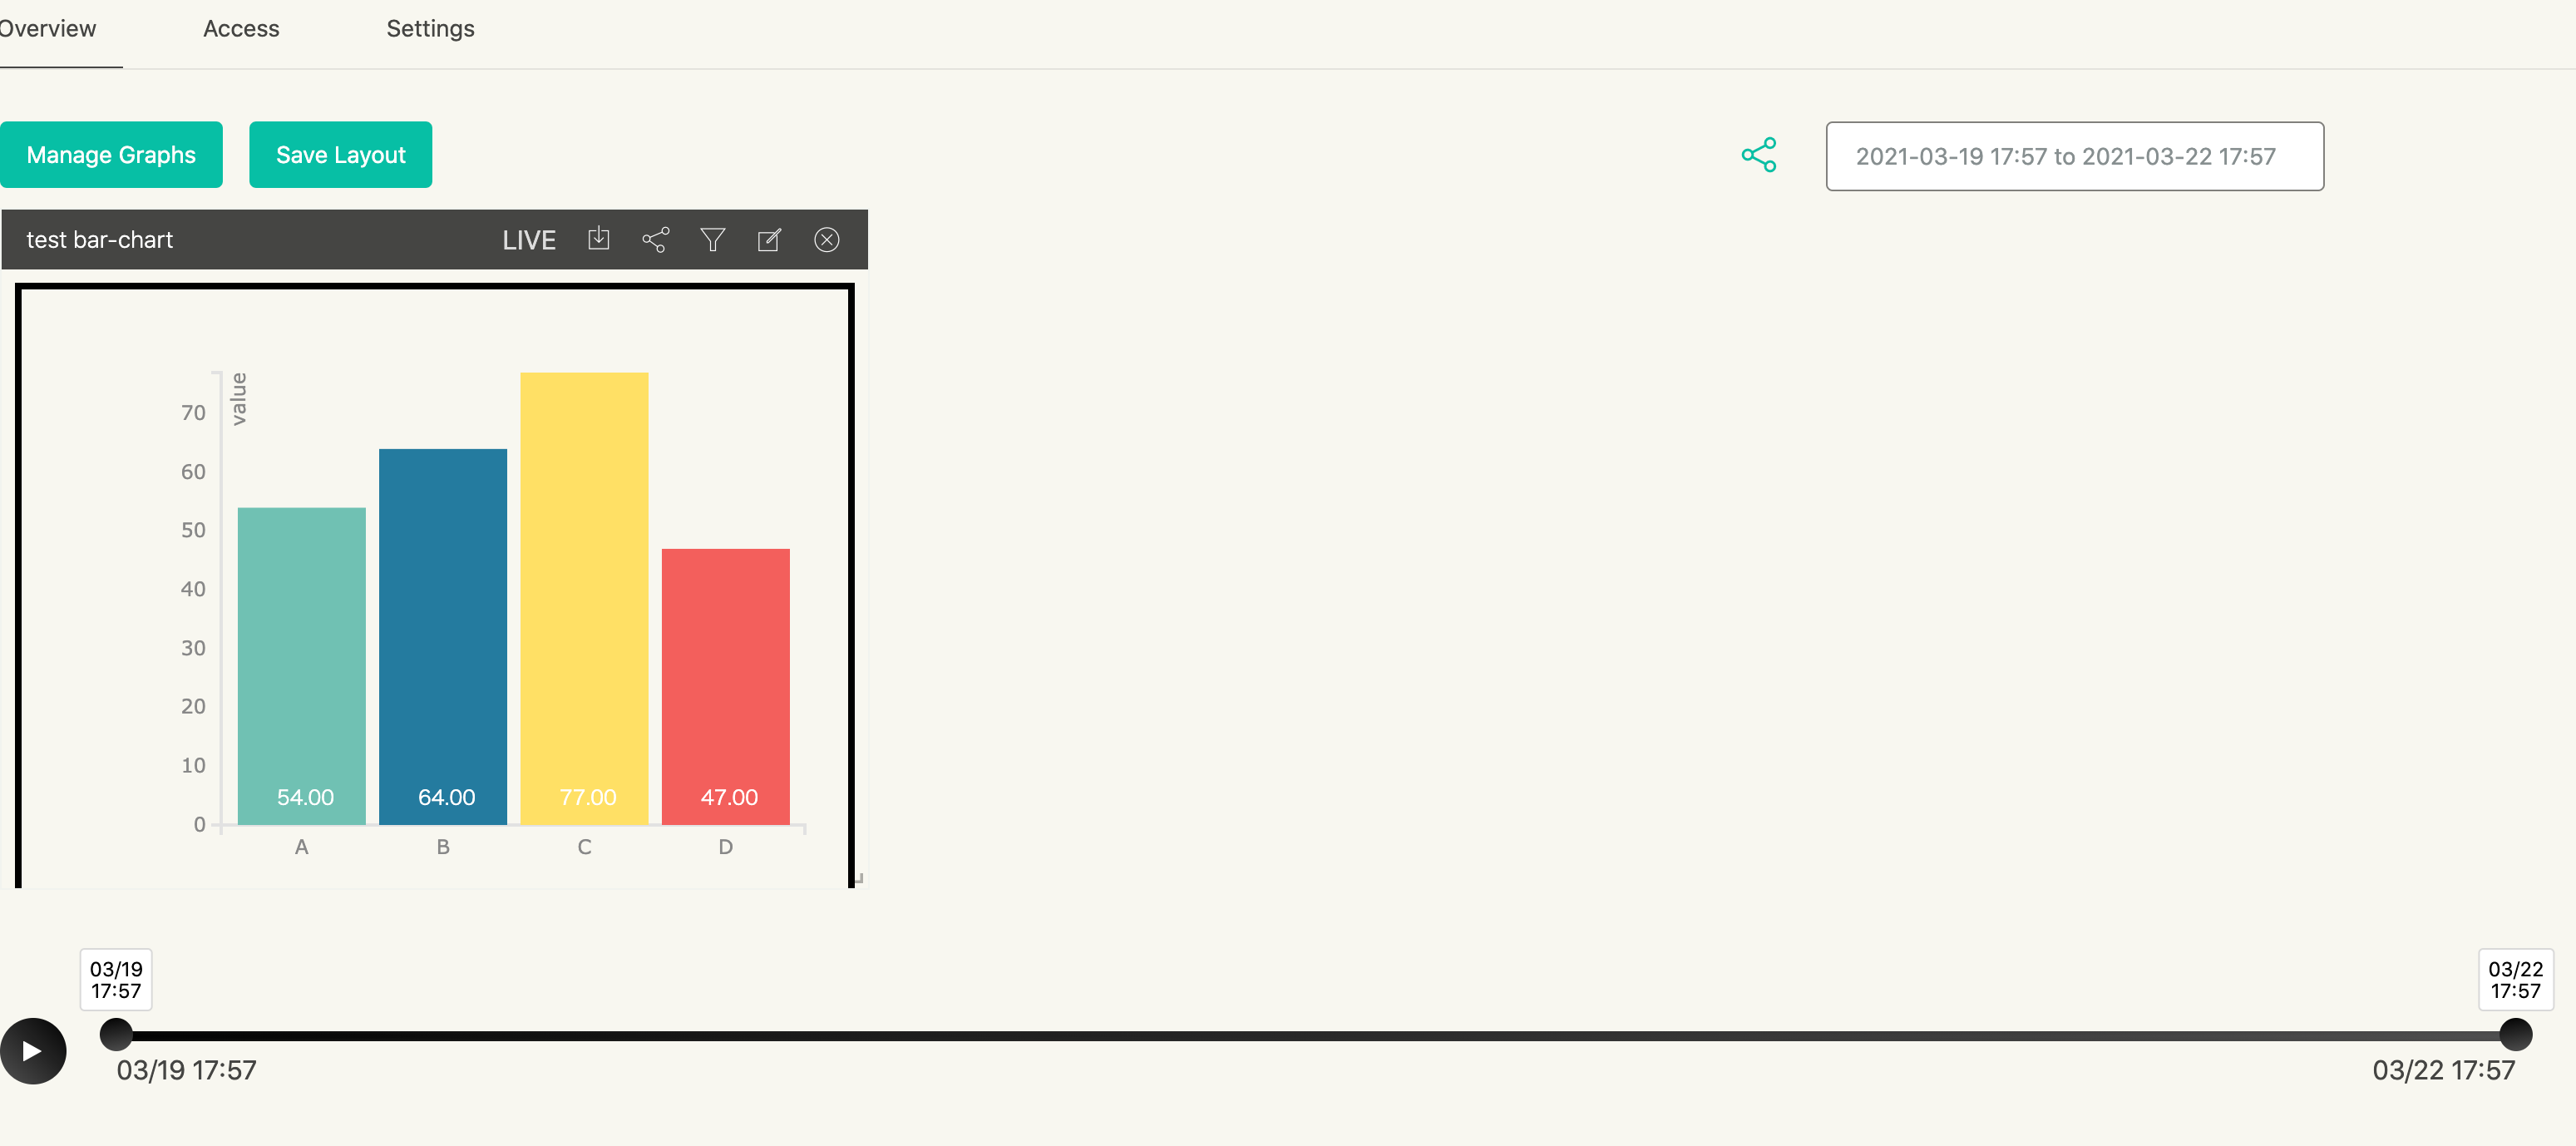
To resize the graph drag its bottom right corner then press "Save" to save the save layout.
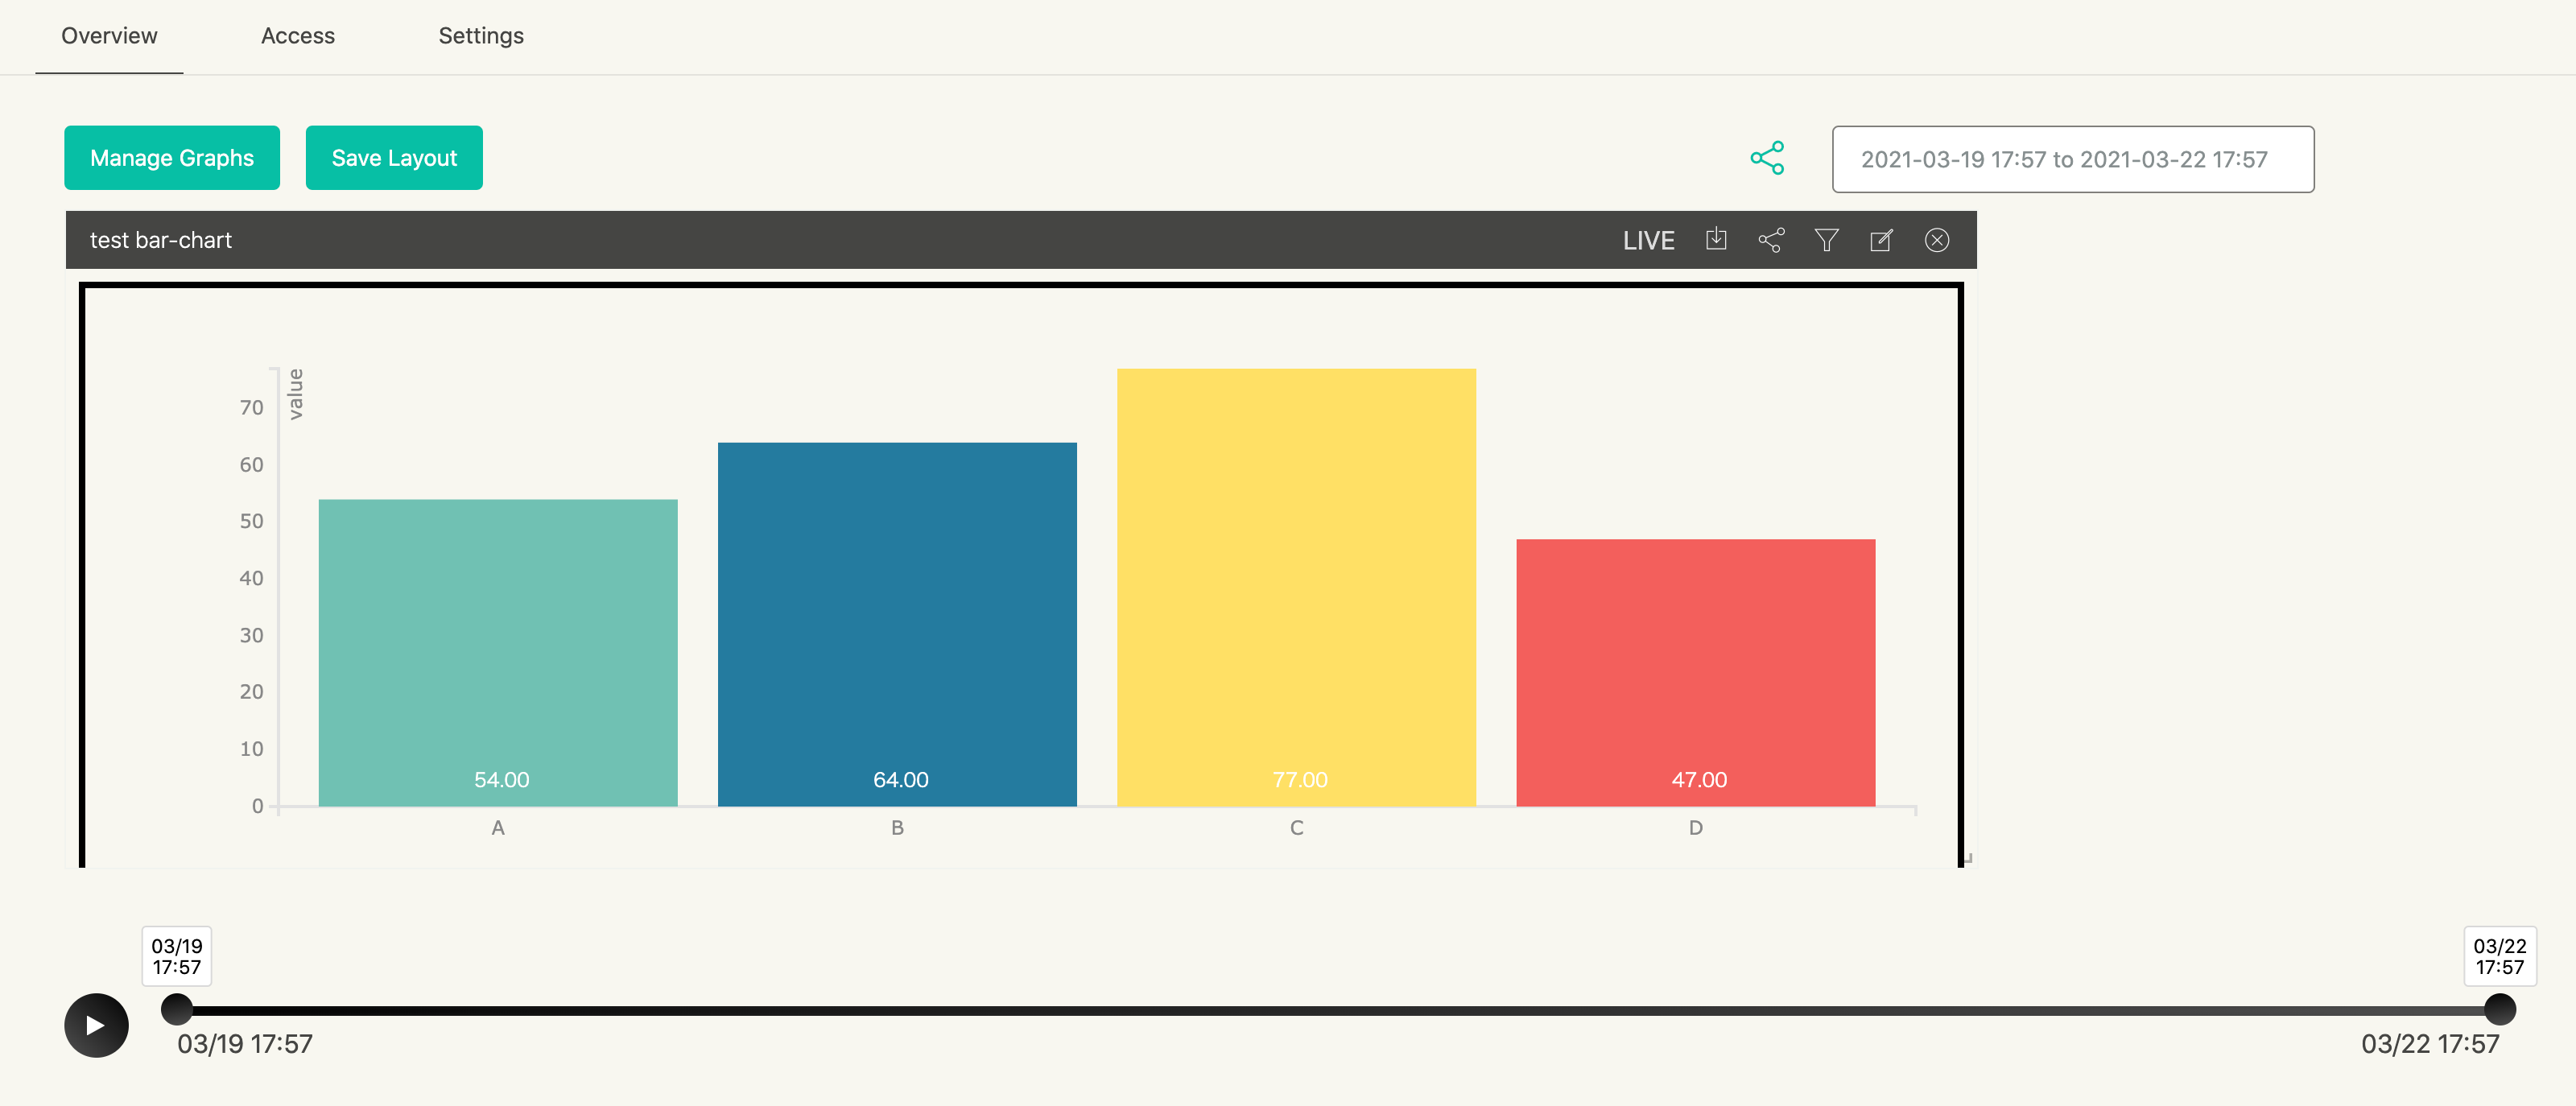
Well Done!
With that, we've been able to go from creating a data flow right through to displaying a graph that uses the data.
While in this tutorial we displayed a simple pre-made bar graph, you can also create, upload and use your own InfoMotion Type. For details, please refer to the InfoMotion Type Creation Tutorial.