InfoMotionの共有
InfoMotionのダッシュボードを別のアプリケーションやビューで利用したい場合、InfoMotionの共有機能を利用することで実現できます。
共有機能を実行するとInfoMotionはHTMLを表示しますので、これを別のアプリケーションやビューに埋め込むことにより、そこからInfoMotionのダッシュボードを利用できるようになります。
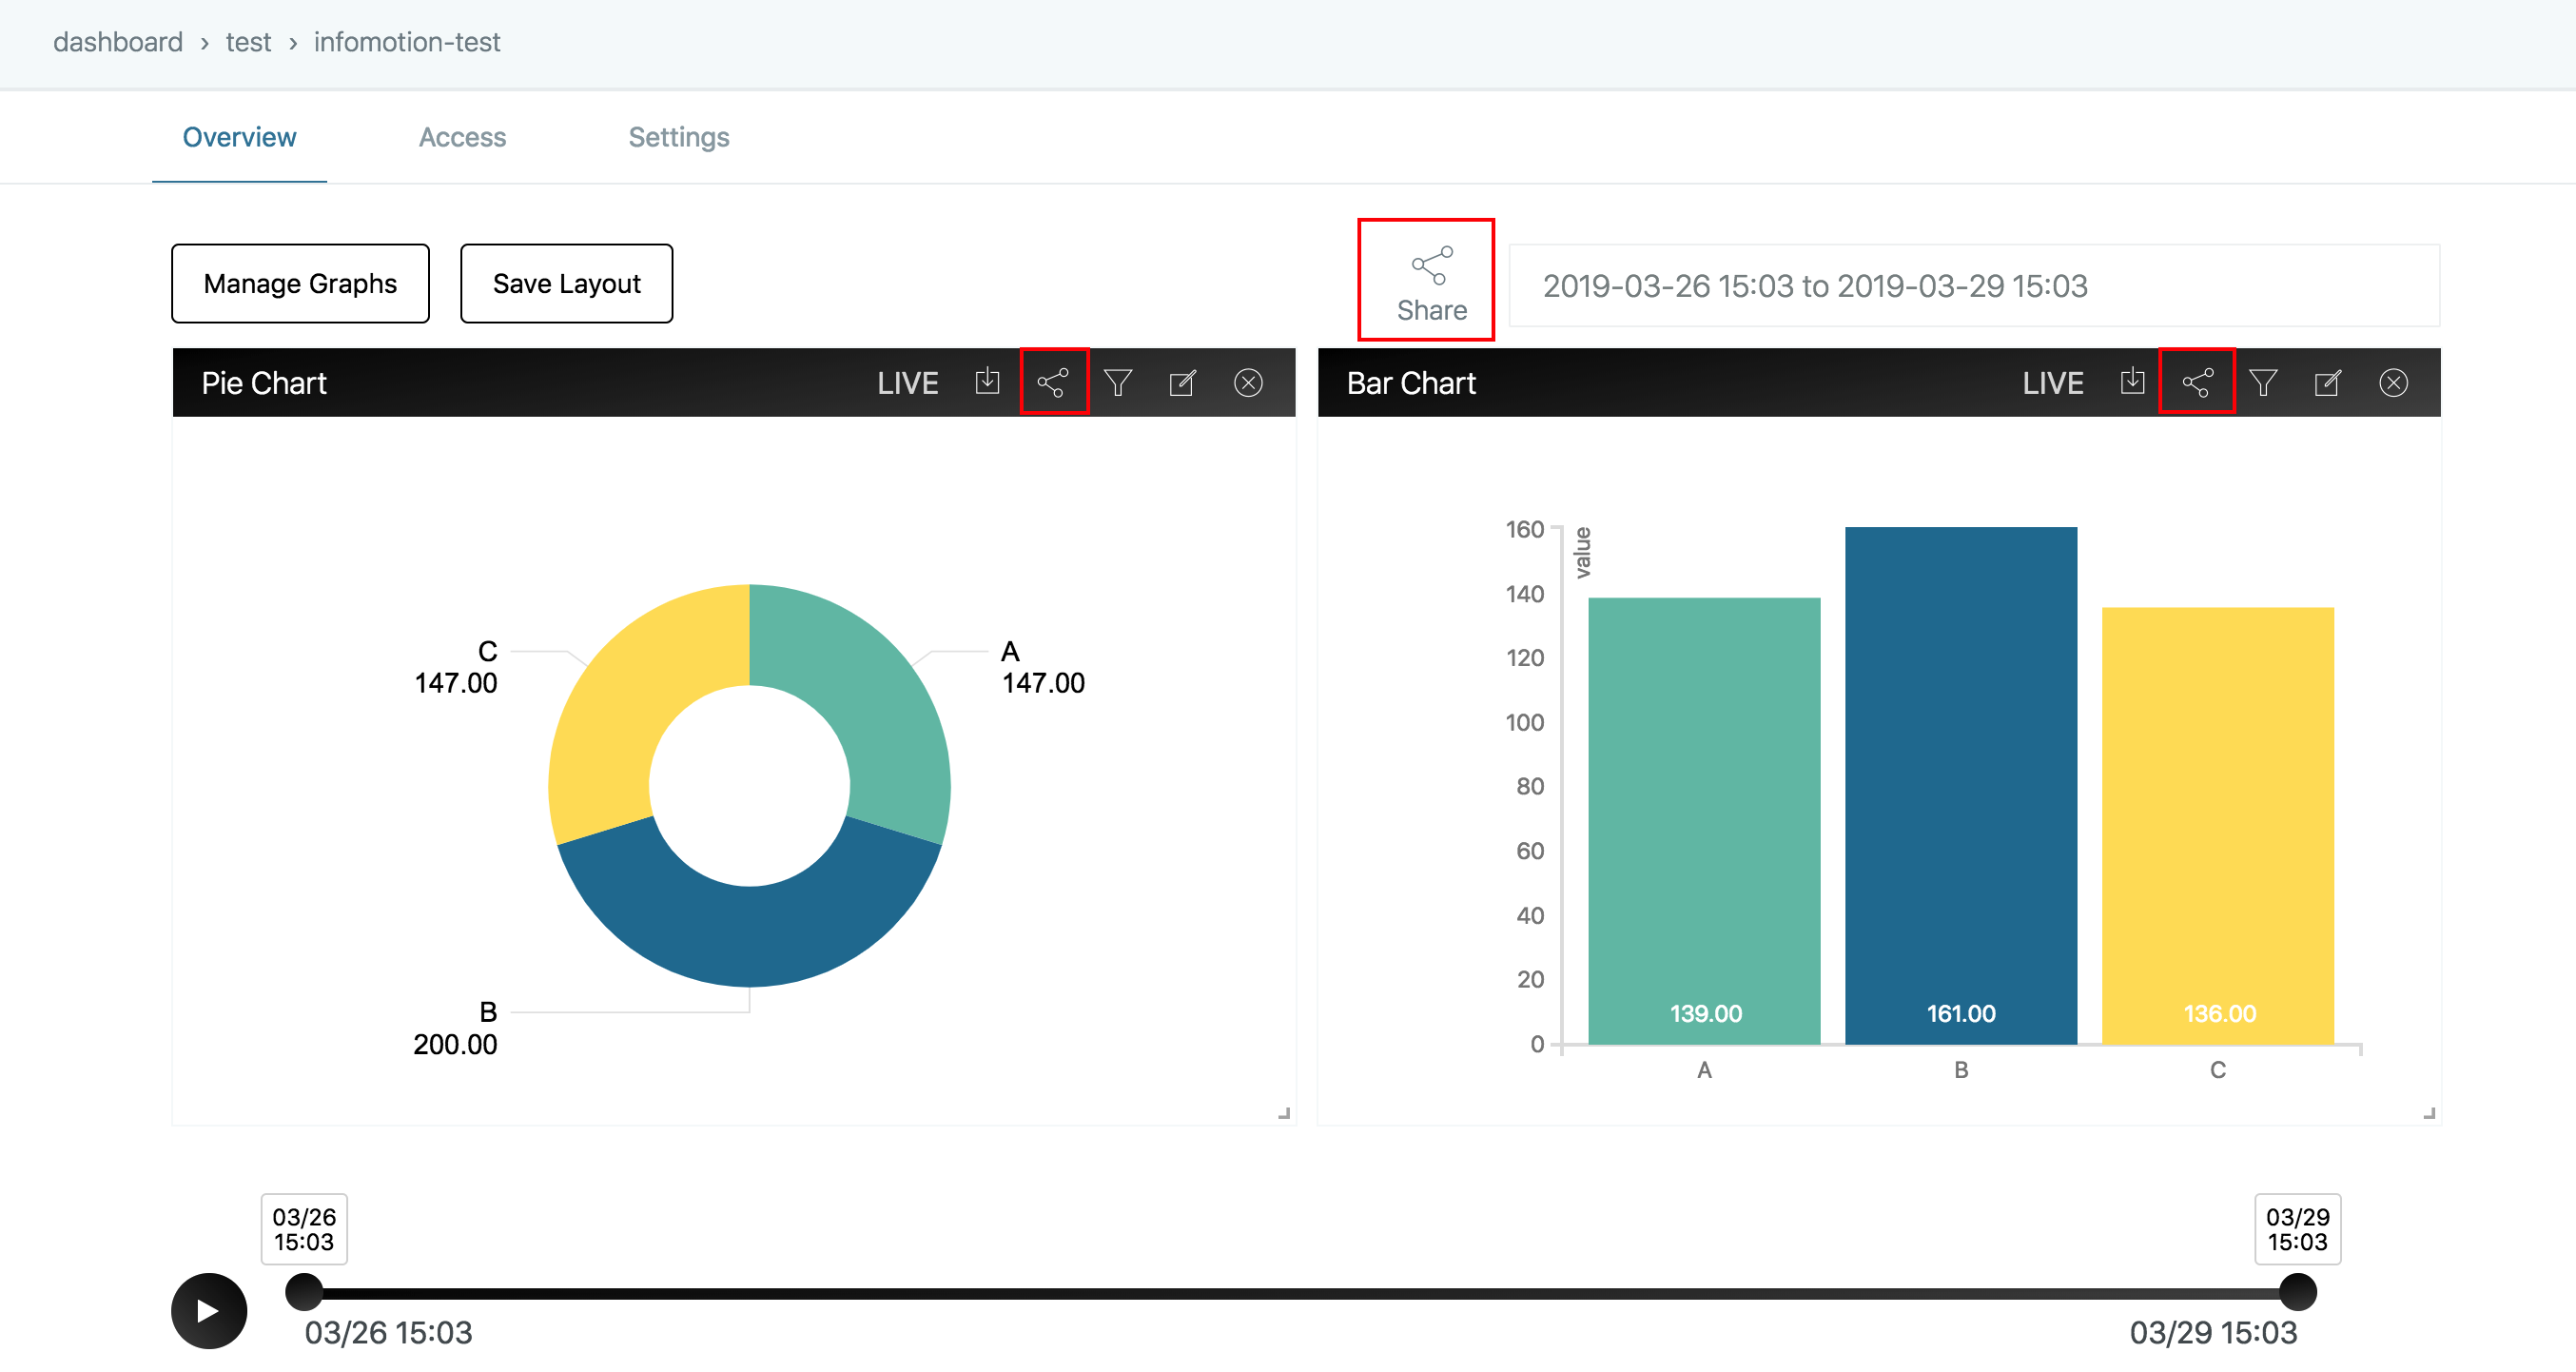
共有機能を利用するには、まずダッシュボードに共有したいグラフを表示する必要があります。
ダッシュボードに表示した複数のグラフをまとめて利用したい場合はダッシュボード上部のShareアイコンをクリックすることで複数のグラフを表示するHTMLを取得でき、個々のグラフのみ共有したい場合は共有したいグラフ上部のShareアイコンをクリックすることでそのグラフを表示するHTMLを取得することができます。
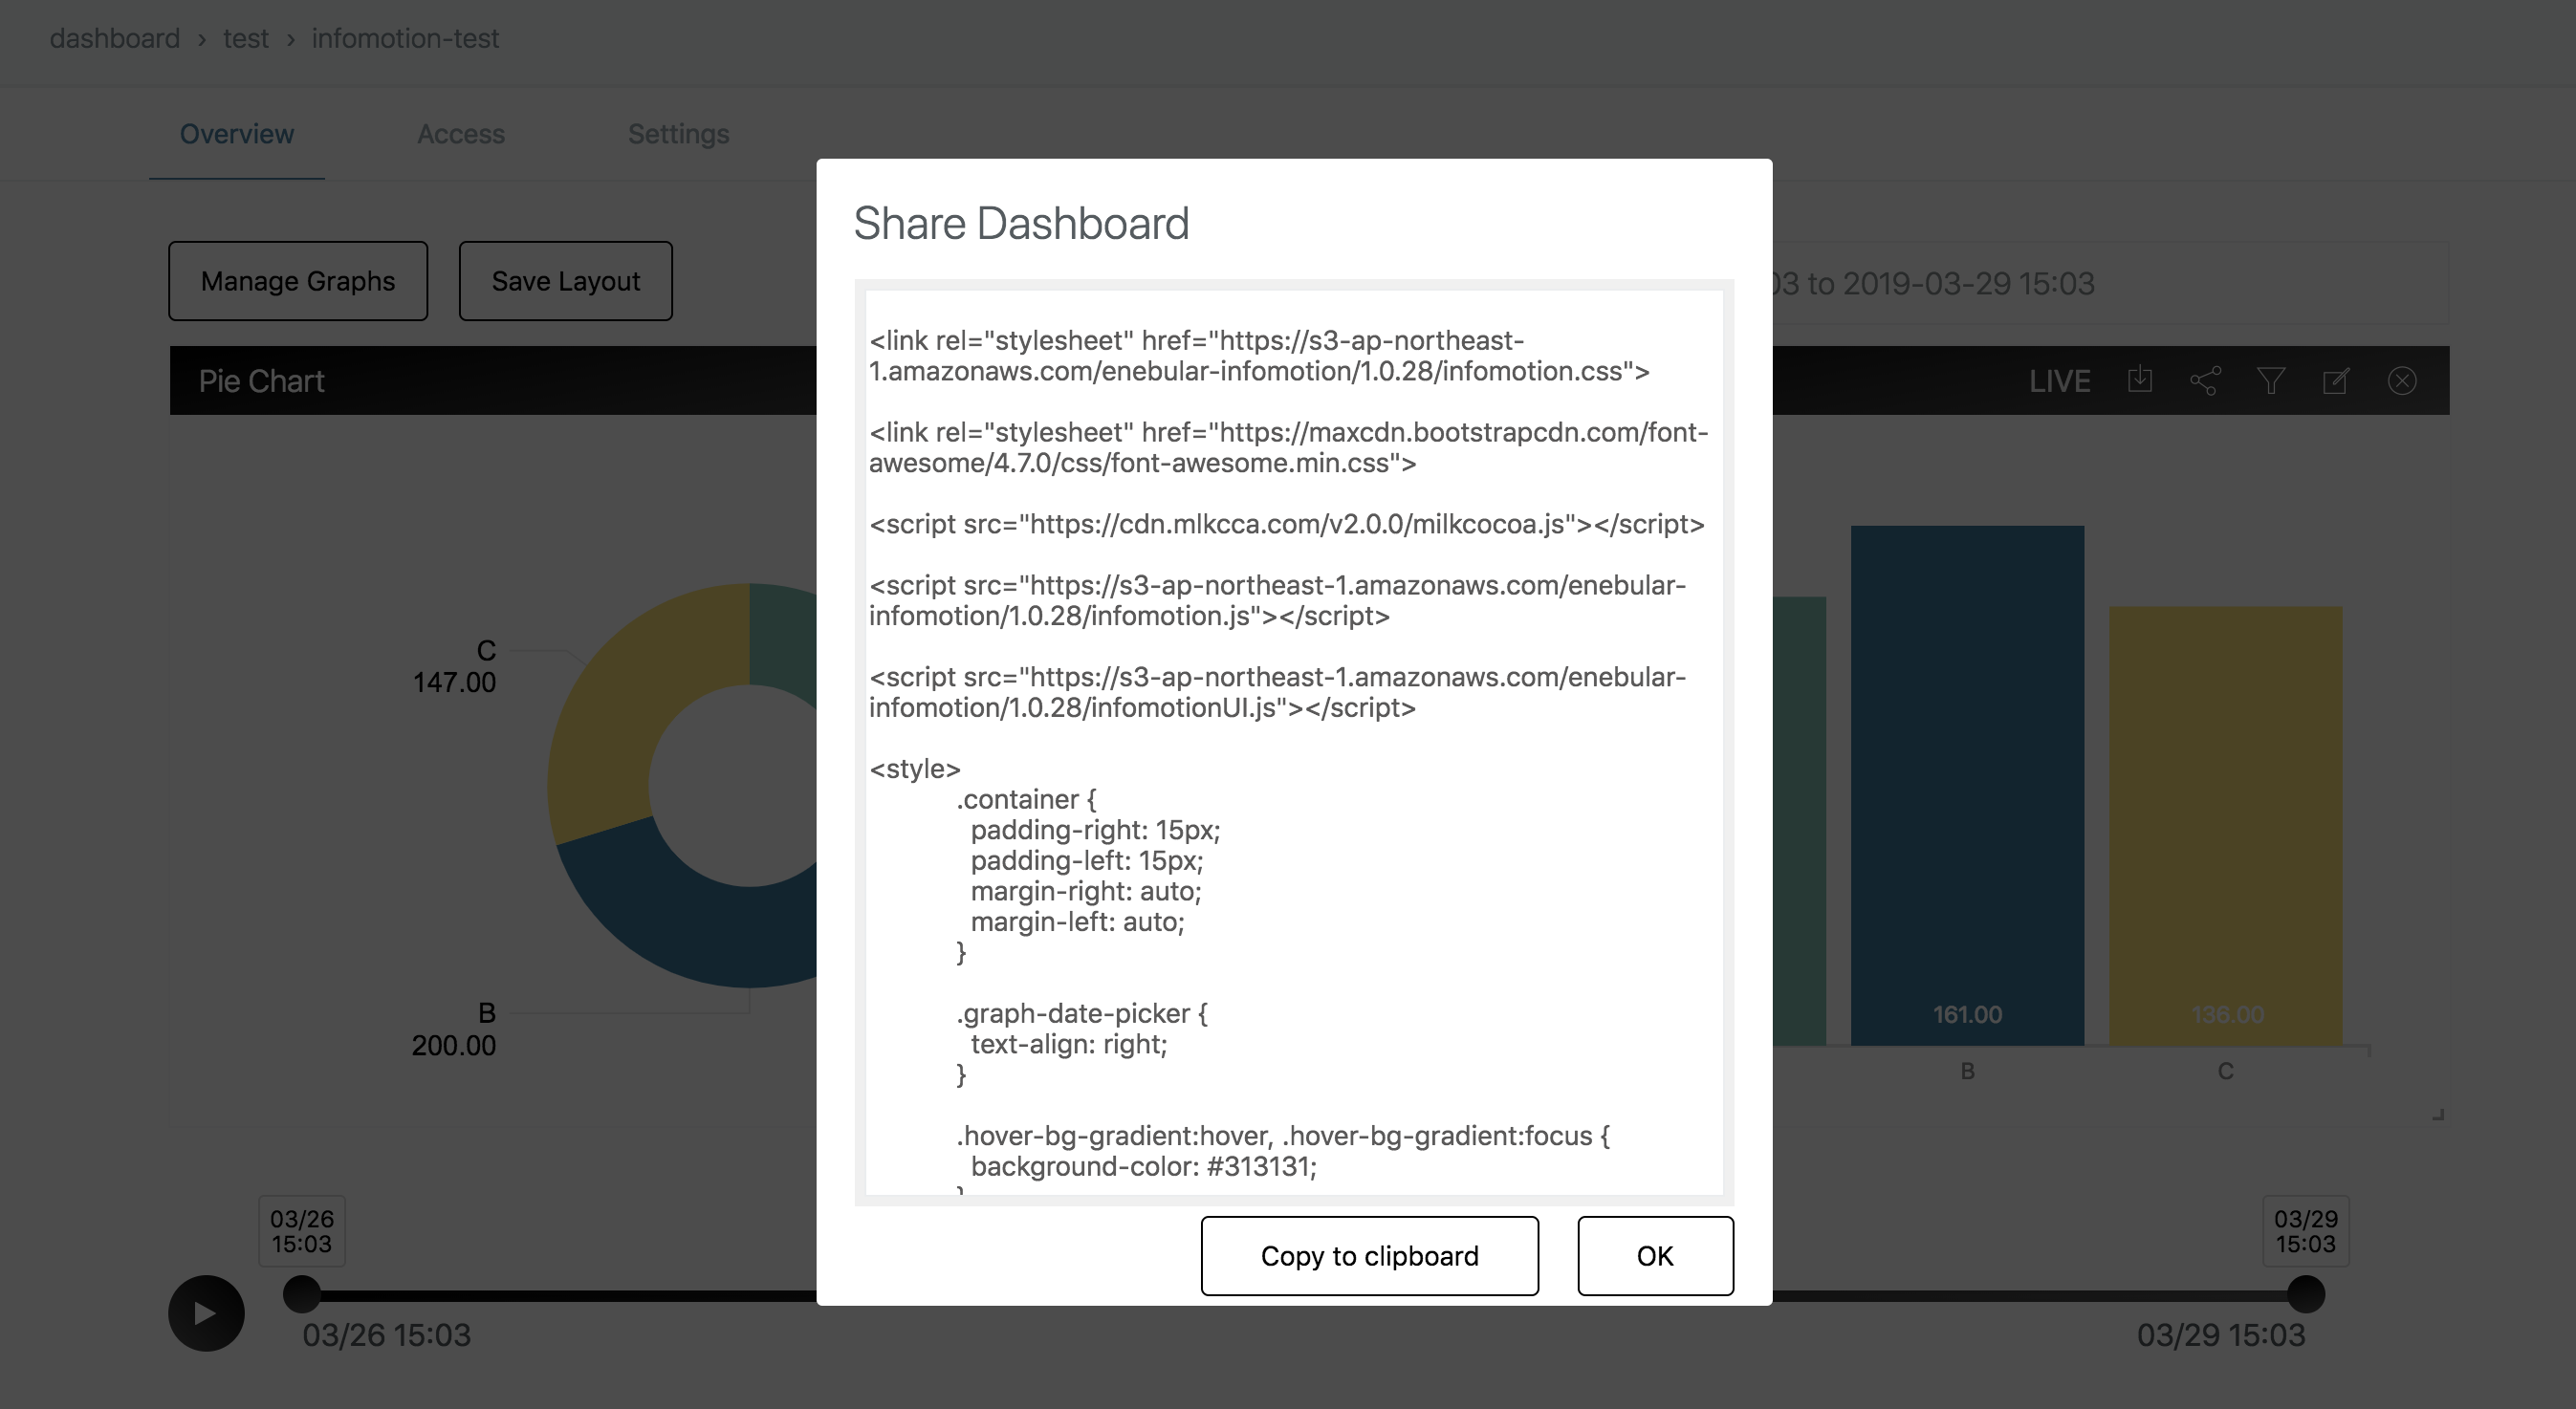
Shareアイコンを押下するとShare Dashboardダイアログが表示され、そこにHTMLが出力されます。"Copy to clipboard"を押下すると、表示されたHTMLがクリップボードにコピーされます。
共有時の注意事項
- 共有機能により取得したHTMLにはフィルターが表示されません
- フィルターを設定した状態でHTMLを共有した場合、フィルターが設定された状態の共有用のHTMLが出力されます
※ フィルター機能については、InfoMotion ダッシュボードページのフィルターの使い方をご確認ください
InfoMotion スクリプト
ダッシュボードを外部サイトへ埋め込む場合、API を使って自由にダッシュボードの表示をカスタマイズできます。
埋め込みには以下の 2 つのファイルを読み込む必要があります。
<script src="https://s3-ap-northeast-1.amazonaws.com/enebular-infomotion/1.0.34/infomotion.js"></script>
<script src="https://s3-ap-northeast-1.amazonaws.com/enebular-infomotion/1.0.34/infomotionUI.js"></script>
グラフコンポーネントの設定
ダッシュボードの設定です。3 つの設定があります。
- cache - キャッシュを使用するかどうかを設定できます。デフォルトは
blackholeでキャッシュを使用しない設定になっています。 - dateRange - Datarange picker のデフォルト値を設定できます。
- options - プラグインの URL を指定しています。ダッシュボードでシェアしたときに自動で生成されるので手入力する必要はありません。
var settings = {
  cache: 'blackhole',
  dateRange: [new Date(1547949452192), new Date(1548208652192)],
  options: {
    pluginPath: 'https://enebular.com',
    iframePath:
      'https://s3-ap-northeast-1.amazonaws.com/enebular-infomotion/iframe.html',
    plugins: [],
    loadingMode: 'loadScript'
  }
}
GraphContext
グラフとコンポーネントをバインドします。
グラフやコンポーネントを作る前に、 graphContext を作成する必要があります。
var graphContext = infomotion.graphContext(settings)
DatePicker
日付指定コンポーネントです。
- withRange([start, end]) - 開始と終了をしていします。
- make() - コンポーネントを作成します。
var datePicker = infomotionUI
  .datePicker(document.querySelector('#enebularDatePicker'))
  .make()
Timeline
DatePicker より細かい時間指定をするコンポーネントです。
var timeline = infomotionUI
  .timeline(
    document.querySelector('#timeline'),
    document.querySelector('#btnControl')
  )
  .make()
LiveButton
リアルタイムモードに切り替えるボタンコンポーネントです。
var liveButton = infomotionUI
  .liveButton(document.querySelector('#btnLive'))
  .make()
GraphContext へコンポーネントを登録
すべてのコンポーネントが make されたら、GraphContext へ登録します。
graphContext
  .useTimeline(timeline)
  .useLiveButton(liveButton)
  .useDatePicker(datePicker)
グラフの設定
グラフの設定です。3 つの設定があります。
- adapter - DataSource の adaptor 設定です。
- graph - グラフ設定です。
- options - プラグインのパスです。
var settingGraph = {
   "adapter":{
      "type":"random",
      "options":{
         "type":"random"
      }
   },
   "graph":{
      "i":"2b2a3243-90e5-478d-8270-ae9f5a4a2bc0",
      "n":"pie",
      "t":"1bb2af23-34eb-4142-8ad6-80b77c3e2816",
      "d":"abdc-1234567",
      "s":{
         "label":"category",
         "value":"value"
      },
      "v":[

      ]
   },
   "options":{
      "pluginPath":"https://enebular.com",
      "iframePath":"https://s3-ap-northeast-1.amazonaws.com/enebular-infomotion/iframe.html",
      "plugins":[
         {
            "title":"piechart",
            "name":"1bb2af23-34eb-4142-8ad6-80b77c3e2816",
            "jsPath":"api/v1/infotype/1bb2af23-34eb-4142-8ad6-80b77c3e2816/download?ext=js",
            "cssPath":"api/v1/infotype/1bb2af23-34eb-4142-8ad6-80b77c3e2816/download?ext=css"
         },
         {
            "title":"barchart",
            "name":"98c21b02-0b3d-4665-a548-b37c1deb43d8",
            "jsPath":"api/v1/infotype/98c21b02-0b3d-4665-a548-b37c1deb43d8/download?ext=js",
            "cssPath":"api/v1/infotype/98c21b02-0b3d-4665-a548-b37c1deb43d8/download?ext=css"
         }
      ],
      "loadingMode":"loadScript"
   }
}
InfoMotionのdivへのバインド
var graph1 = infomotionUI.graph(document.querySelector('#graph'), settingGraph)
graphContext へのグラフの登録
graphContext.useGraphs(graph1)
graphContext からグラフを削除
graphContext.removeGraph(graph1)
フィルターの設定
graph0.useFilter([
  {
    key: 'category',
    values: ['A', 'B']
  }
])
例
<link rel="stylesheet" href="https://s3-ap-northeast-1.amazonaws.com/enebular-infomotion/1.0.34/infomotion.css">

<link rel="stylesheet" href="https://maxcdn.bootstrapcdn.com/font-awesome/4.7.0/css/font-awesome.min.css">

<script src="https://s3-ap-northeast-1.amazonaws.com/enebular-infomotion/1.0.34/infomotion.js"></script>

<script src="https://s3-ap-northeast-1.amazonaws.com/enebular-infomotion/1.0.34/infomotionUI.js"></script>

<style>
            .container {
              padding-right: 15px;
              padding-left: 15px;
              margin-right: auto;
              margin-left: auto;
            }

            .graph-date-picker {
              text-align: right;
            }

            .hover-bg-gradient:hover, .hover-bg-gradient:focus {
              background-color: #313131;
            }

            .hover-bg-gradient {
              background-image: linear-gradient(45deg, rgba(81, 81, 81, 0) 0%, #000 100%);
              background-color: #515151;
            }

            .bg-gradient {
                background: linear-gradient(-10deg, #515151 0%, #000 100%);
            }

            .btn-dashboard-primary {
                color: #ffffff;
                font-weight: 300;
                transition: background-color .2s ease-in;
                transition-property: background-color,color;
            }

            .enebular-datepicker {
                border-radius: 1px;
                border: 1px solid #F2F3F4;
                color: #646e6f;
                font-weight: 300;
                padding: 12px 17px;
                width: 50%;
            }

            .graph-date-picker #datePicker {
                padding: 8px 0 8px 8px;
                width: 100%
            }

            .infomotion-timeline {
                margin-top: 60px;
            }

            .action-control-wrapper {
                width: 70px;
                float: left;
            }

            .timeline-wrapper {
                width: calc(100% - 70px);
                float: left;
                padding-top: 15px;
                padding-right: 15px;
            }

            .control-live {
                float: left;
                width: 60px;
                margin-top: 62px;
            }

            .control-timeline {
                width: calc(100% - 60px);
                float: left;
            }

            .infomotion-graph-0 {
                    transform: translate(10px, 10px);
                    width: 532px;
                    height: 410px;
                    position: absolute;
                }
.infomotion-graph-1 {
                    transform: translate(552px, 10px);
                    width: 532px;
                    height: 410px;
                    position: absolute;
                }

            @media (max-width: 768px) {
              .infomotion-graph {
                width: 100%;
                transform: none;
                position: inherit;
                padding-bottom: 10px;
              }
            }
            @media (min-width: 768px) {
              .container {
                width: 750px;
              }

            }
            @media (min-width: 992px) {
              .container {
                width: 970px;
              }
            }
            @media (min-width: 1200px) {
              .container {
                width: 1170px;
              }
            }

            </style>

<div class="container">

  <div class="graph-date-picker">

    <input id="enebularDatePicker" class="enebular-datepicker" type="date">

  </div>

  <div class="enebular-clear-both"></div>

  <div class="control-live">

    <button id="btnLive" class="enebular-btn">

      <i class="fa fa-bolt fa-lg"></i>

    </button>

  </div>

  <div class="control-timeline">

    <div class="infomotion-timeline">

      <div class="action-control-wrapper">

        <button id="btnControl" class="enebular-btn enebular-btn-control bg-gradient hover-bg-gradient">

          <i class="fa fa-play"></i>

        </button>

      </div>

      <div class="timeline-wrapper" id="timeline"></div>

      <div class="enebular-clear-both"></div>

    </div>

  </div>

  <div class="enebular-clear-both"></div>


  <div class="infomotion-graph infomotion-graph-0" id="graph0"></div>


  <div class="infomotion-graph infomotion-graph-1" id="graph1"></div>


  <div class="enebular-clear-both"></div>

</div>

<script>
            var settings = {
               "cache":"blackhole",
               "dateRange":[new Date(1554118192026), new Date(1554377392026)],
               "options":{
                  "pluginPath":"https://enebular.com",
                  "iframePath":"https://s3-ap-northeast-1.amazonaws.com/enebular-infomotion/1.0.28/iframe.html",
                  "plugins":[
                     {
                        "title":"piechart",
                        "name":"1bb2af23-34eb-4142-8ad6-80b77c3e2816",
                        "jsPath":"api/v1/infotype/1bb2af23-34eb-4142-8ad6-80b77c3e2816/download?ext=js",
                        "cssPath":"api/v1/infotype/1bb2af23-34eb-4142-8ad6-80b77c3e2816/download?ext=css"
                     },
                     {
                        "title":"barchart",
                        "name":"98c21b02-0b3d-4665-a548-b37c1deb43d8",
                        "jsPath":"api/v1/infotype/98c21b02-0b3d-4665-a548-b37c1deb43d8/download?ext=js",
                        "cssPath":"api/v1/infotype/98c21b02-0b3d-4665-a548-b37c1deb43d8/download?ext=css"
                     }
                  ],
                  "loadingMode":"loadScript"
               }
            }

            var graphContext = infomotion.graphContext(settings);

            var datePicker = infomotionUI.datePicker(document.querySelector('#enebularDatePicker'))
            .make();

            var timeline = infomotionUI.timeline(
                    document.querySelector('#timeline'),
                    document.querySelector('#btnControl')
            ).setTheme('black').make();

            var liveButton = infomotionUI.liveButton(document.querySelector('#btnLive'))
                .make();

            graphContext
                .useTimeline(timeline)
                .useLiveButton(liveButton)
                .useDatePicker(datePicker)

            var settingGraph0 = {
                   "adapter":{
                      "type":"random",
                      "options":{
                         "type":"random"
                      }
                   },
                   "graph":{
                      "i":"2b2a3243-90e5-478d-8270-ae9f5a4a2bc0",
                      "n":"pie",
                      "t":"1bb2af23-34eb-4142-8ad6-80b77c3e2816",
                      "d":"abdc-1234567",
                      "s":{
                         "label":"category",
                         "value":"value"
                      },
                      "v":[

                      ]
                   },
                   "options":{
                      "pluginPath":"https://enebular.com",
                      "iframePath":"https://s3-ap-northeast-1.amazonaws.com/enebular-infomotion/iframe.html",
                      "plugins":[
                         {
                            "title":"piechart",
                            "name":"1bb2af23-34eb-4142-8ad6-80b77c3e2816",
                            "jsPath":"api/v1/infotype/1bb2af23-34eb-4142-8ad6-80b77c3e2816/download?ext=js",
                            "cssPath":"api/v1/infotype/1bb2af23-34eb-4142-8ad6-80b77c3e2816/download?ext=css"
                         },
                         {
                            "title":"barchart",
                            "name":"98c21b02-0b3d-4665-a548-b37c1deb43d8",
                            "jsPath":"api/v1/infotype/98c21b02-0b3d-4665-a548-b37c1deb43d8/download?ext=js",
                            "cssPath":"api/v1/infotype/98c21b02-0b3d-4665-a548-b37c1deb43d8/download?ext=css"
                         }
                      ],
                      "loadingMode":"loadScript"
                   }
                }

            var settingGraph1 = {
                   "adapter":{
                      "type":"random",
                      "options":{
                         "type":"random"
                      }
                   },
                   "graph":{
                      "i":"a43a6692-b57d-4fde-90af-2e73a35f460e",
                      "n":"bar",
                      "t":"98c21b02-0b3d-4665-a548-b37c1deb43d8",
                      "d":"abdc-1234567",
                      "s":{
                         "label":"category",
                         "value":"value"
                      },
                      "v":[

                      ]
                   },
                   "options":{
                      "pluginPath":"https://enebular.com",
                      "iframePath":"https://s3-ap-northeast-1.amazonaws.com/enebular-infomotion/iframe.html",
                      "plugins":[
                         {
                            "title":"piechart",
                            "name":"1bb2af23-34eb-4142-8ad6-80b77c3e2816",
                            "jsPath":"api/v1/infotype/1bb2af23-34eb-4142-8ad6-80b77c3e2816/download?ext=js",
                            "cssPath":"api/v1/infotype/1bb2af23-34eb-4142-8ad6-80b77c3e2816/download?ext=css"
                         },
                         {
                            "title":"barchart",
                            "name":"98c21b02-0b3d-4665-a548-b37c1deb43d8",
                            "jsPath":"api/v1/infotype/98c21b02-0b3d-4665-a548-b37c1deb43d8/download?ext=js",
                            "cssPath":"api/v1/infotype/98c21b02-0b3d-4665-a548-b37c1deb43d8/download?ext=css"
                         }
                      ],
                      "loadingMode":"loadScript"
                   }
                }


                var graph0 = infomotionUI.graph(document.querySelector('#graph0'), settingGraph0);

                    graph0.render();
                    graphContext.useGraphs(graph0);
                    graph0.useFilter([])
                var graph1 = infomotionUI.graph(document.querySelector('#graph1'), settingGraph1);

                    graph1.render();
                    graphContext.useGraphs(graph1);
                    graph1.useFilter([])
            </script>