This document is not up-to-date, please refer to the Japanese document.
Logs
In enebular, you can check the logging of a paid device by turning on the monitoring setting of the device.
- For the monitoring settings, refer to Device List.
The specifications of the log output by enebular-agent and enebular-edge-agent are different.
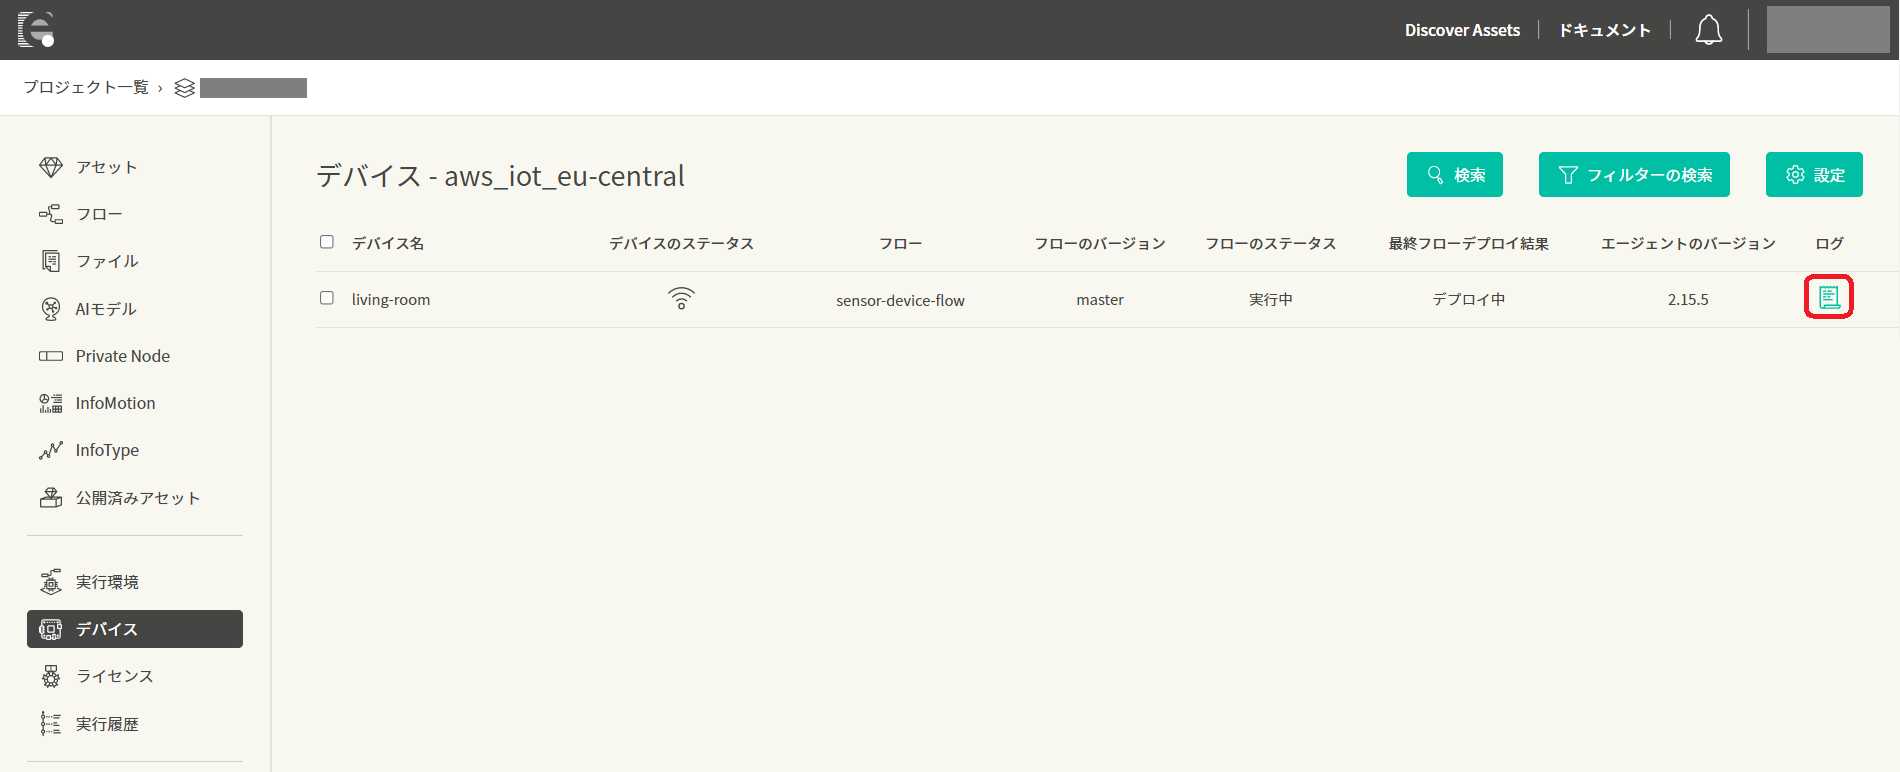
To view the log, please click [View Logs] in the right part of the target device.
enebular-agent log
The enebular-agent sends the log output to the console (stdout / stderr) to enebular.
By default, only logs of info level are output. You can change the output setting to the debug level with the environment variable DEBUG.
The enebular agent also captures all logs that Node-RED outputs to the console. All log contents captured from Node-RED will be logged as the log level of info.
After startup, logs are sent every 30 seconds for 3 minutes after flow deployment, then every 5 minutes thereafter. Logs are also sent when the system shuts down.
Node-RED log
The log output by Node-RED depends on Node-RED setting and node setting. For details, please refer to Node-RED Documentation.
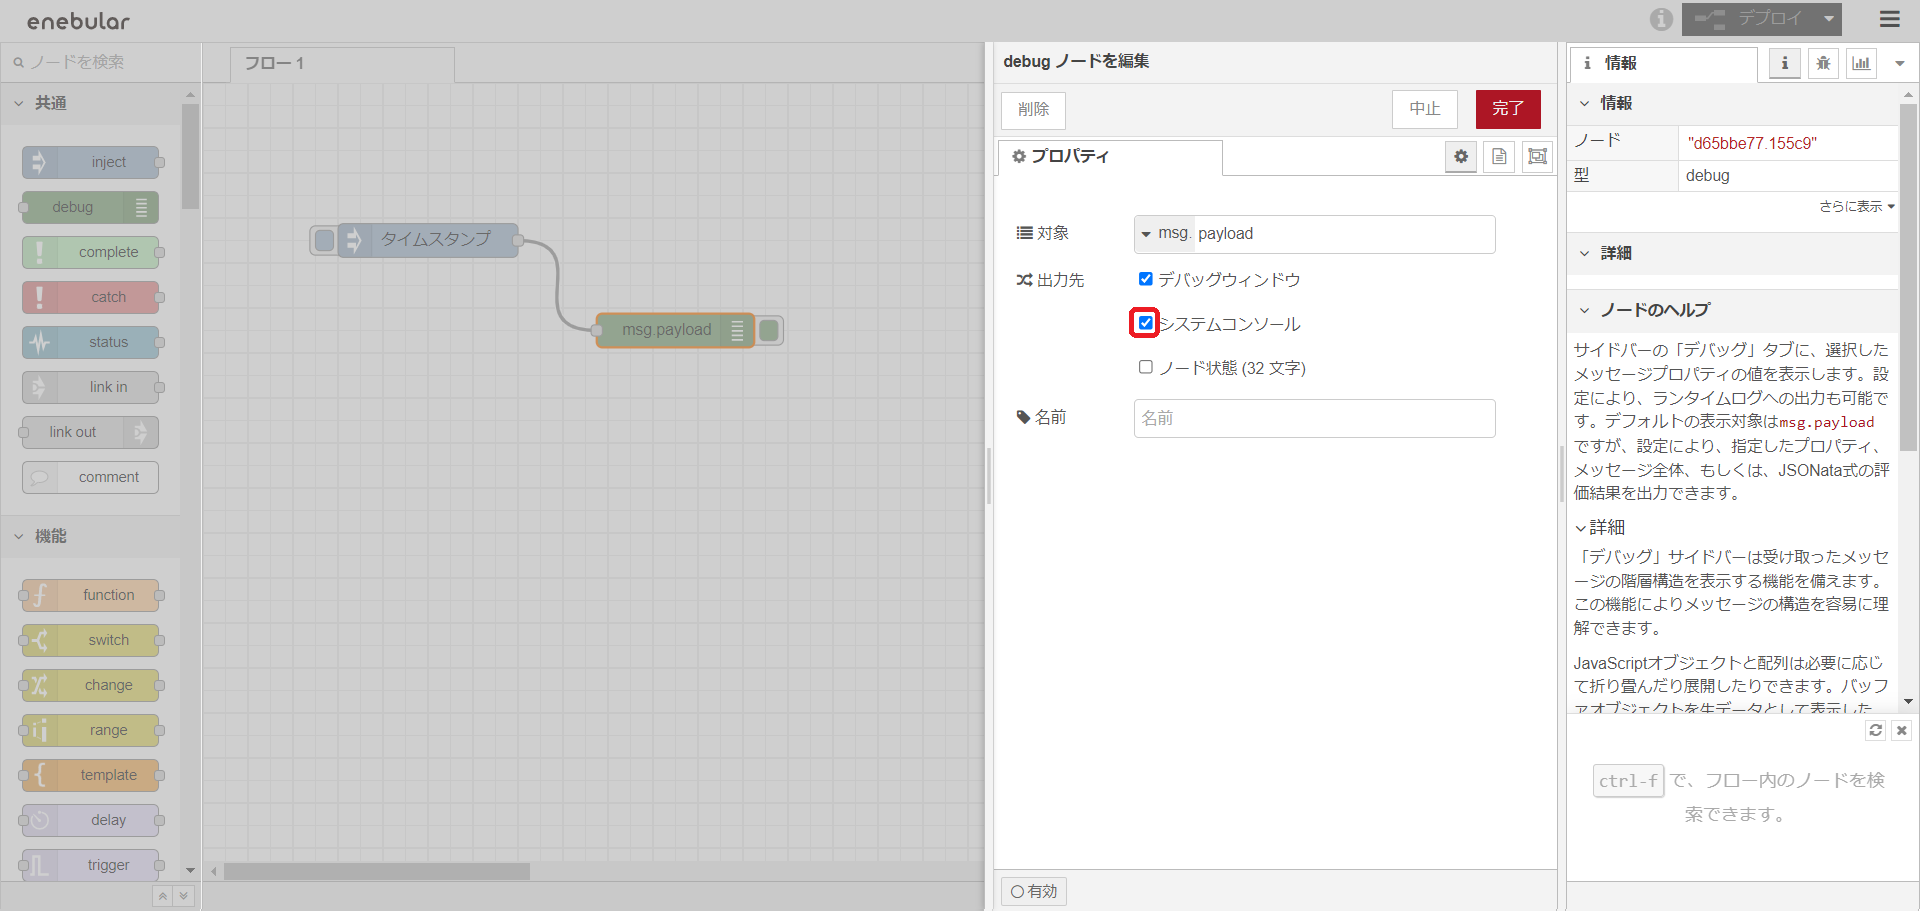
If you want to output the log of the Debug node, output to the console is enabled by setting the Debug node to debug tab and console.
How to read the log screen
This is an example of the enebular-agent's log screen.
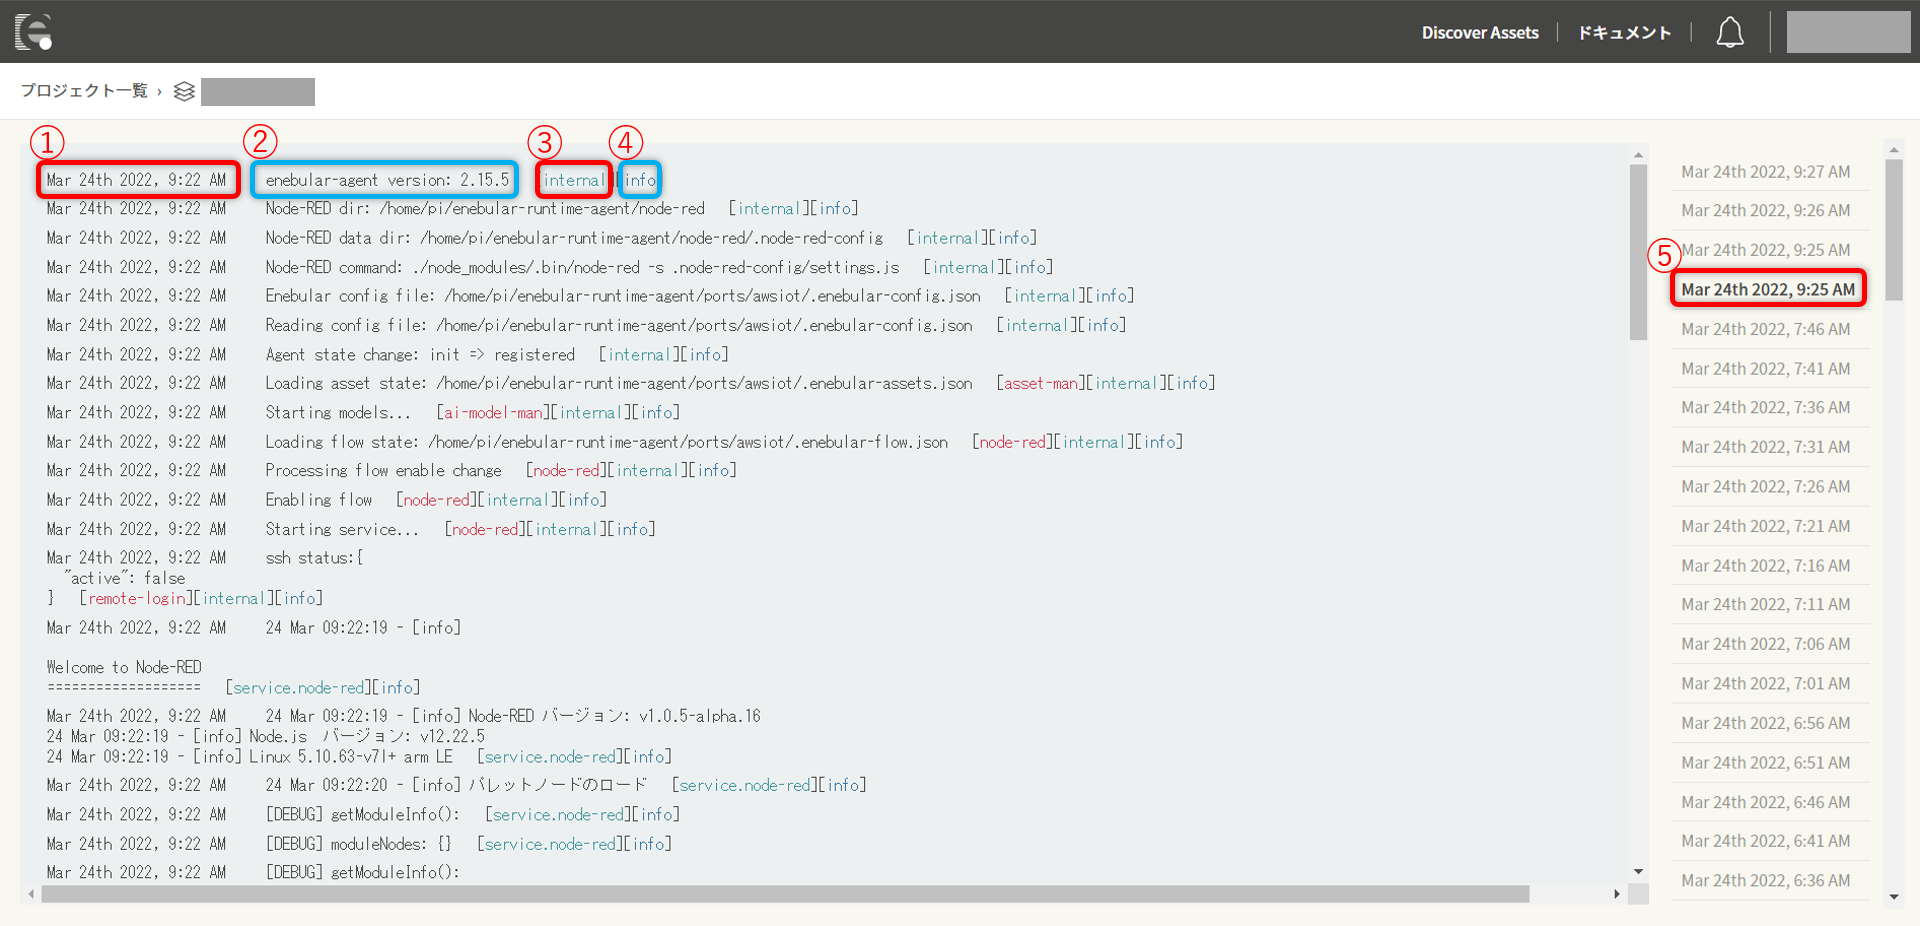
- Timestamp of log output
- Log
- The service that outputs logs * Internal refers to enebular-agent
- Log Level
- Timestamp when enebular received the log * By clicking the timestamp, you can select the time of the log to be viewed
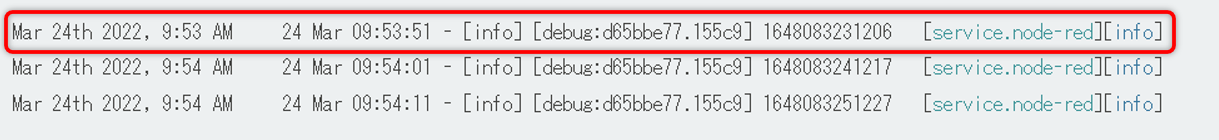
The log output from the Debug node is displayed as follows.
enebular-edge-agent log
enebular-edge-agent sends operation logs and error logs to enebular. Logs are sent 30 seconds after booting the device, thereafter every 5 minutes.
How to read the log screen
This is an example of the enebular-edge-agent log screen.
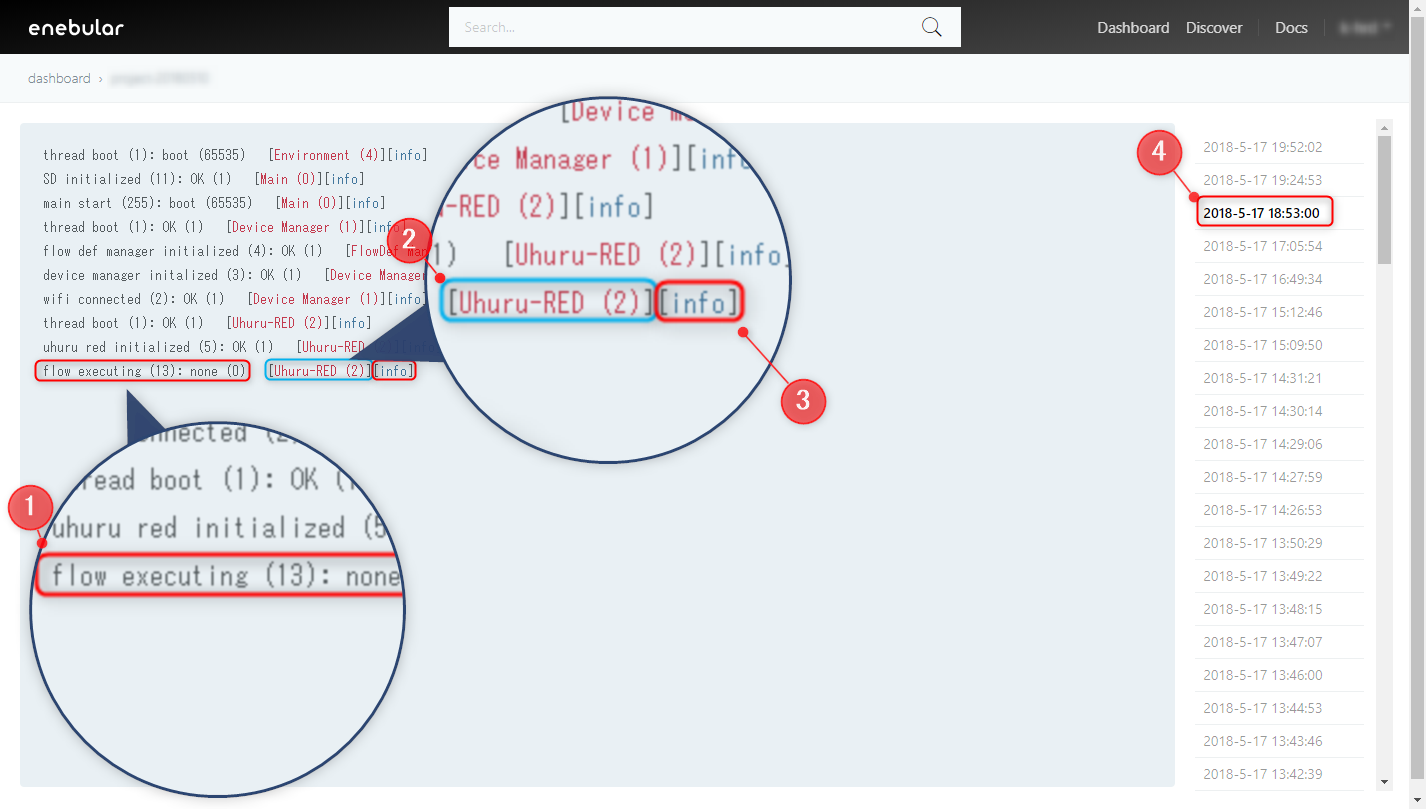
- Log
- Function name that output log
- Log Level
- Timestamp when enebular received the log
By clicking the timestamp, you can select the time of the log to be viewed
enebular-edge-agent log list
Below are the operation logs and error logs of the enebular-edge-agent. For further information please contact [email protected].
operation log
| Log |
|---|
| main start |
| thread boot |
| wifi connected |
| device manager initialized |
| flow def manager initialized |
| uhuru red initialized |
| SD initialized |
| flow deployed |
| flow executing |
| flow executed |
| flash updated: device bundle |
| flash updated: flow define |
| storage initialized |
error log
| Log |
|---|
| flow URL connect timeout |
| flow download failed |
| flow data error |
| flow size over |
| writing flow failed |
| reading flow failed |
| flow URL size over |
| mbed cloud factory configurator client error |
| flow runtime not found |
| flow file not found |
| js interpreter error |
| js flow json parse error |
| js node initialize error |
| js flow stopped error |
| js flow execute error |
| js waiting list overflow |
| device auth none license |
| device auth https error |
| device auth invalid |
| token https error |
| activate device https error |
| log https error |
Log Export
Log Export function allows you to download logs of enebular devices in the selected period.
Log Export parameters are:
- Project (only Enterprise projects allowed)
- Period (dates in UTC between which logs were sent)
By specifying above, you can export logs sent by licensed devices in the specified period in specified projects.
Log Export Procedure
The procedure of Log Export consists of:
- Navigate to a specific project from the project selection screen.
- Click on the
Deviceson the left menu. - Click on the
Export Logsbutton on the upper right corner. - Select a specific period from the calendar and click the
Exportbutton.
Then the Log Export procedure will start. The result of Log Export would be sent to the email. Depending on the number of logs, it may take up to 24 hours.
The email would contain the link to download a ZIP file that contains exported logs. The link is valid for 24 hours.
ZIP file
Multiple ZIP files can be generated if there are too many logs to export. The division rules are as follows:
- add all the log files by devices and compress them into a single ZIP file within a range not exceeding 10000 files
- if the log files generated by one device exceeds 10000, compress them into a single ZIP file
The name of the compressed ZIP file is <Project name>.zip.
If there are multiple ZIP files, then <Project name>_<N>.zip (N is an integer starting from 1).
ZIP file structure:
<Project name>folder<Connection name>folder (if the folder with the same connection name already exists, then add_<M>(M is an integer starting from 1))<DeviceId>folder(Pelion Device Name for Pelion devices)<Unix Epoch time>.jsonfolder(for example: 1560506700000.json)
Log Export Constraints
- the number of log files that can be exported at a time is 1.2 million files (usually, Devices send log files once every 5 minutes, so if, for example, 200 devices would send an around 20 days worth of logs)
- the maximum selectable period is 30 days
- only one Log Export at a time can be performed in the same project
- Log Export may not be performed if the system is in Busy state (try again in a few hours)